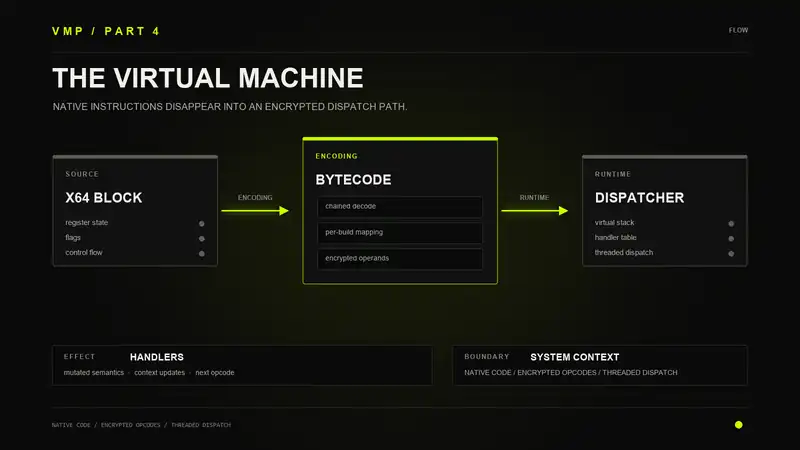
Parts 1 through 3 covered how VMProtect packs a binary and gets it running again at launch. That whole process exists to protect the file on disk and make debugging harder. But the core of what VMProtect actually does to your code has nothing to do with packing. It is the virtualizer. It takes native x86 or x64 instructions, converts them into a custom bytecode, and replaces the original code with a tiny stub that calls into an interpreter. The original instructions are gone. What runs instead is a software CPU.
I dug into how this works and there is a lot going on.
Architecture
The VM is stack-based. It does not try to simulate x86 registers directly. Instead it has a virtual stack where all operands go. If the original code does add eax, ebx, the VM pushes the values of both registers onto its internal stack, runs an add handler, and the result lands on top. A separate write handler moves it back to the right register slot.
There are four dedicated machine registers that the VM uses internally. One points to the top of the virtual stack. One is the bytecode pointer that tracks where we are in the instruction stream. One is used for encrypted jumps between handlers. And the last is a crypto register used for decrypting the next opcode on the fly. These are assigned to real x86 registers, but which ones get used is randomized per build.
The Dispatcher
The interpreter loop is simple in concept. It reads a byte from the bytecode stream, decrypts it to get the actual opcode index, looks up the handler in a table, and jumps to it. The handler does its thing, then jumps back to the dispatcher for the next opcode.
But there is a twist. The opcode byte in the stream is not the real opcode. It is encrypted with the crypto register using a chain of operations like add, xor, rotate, or bswap. The decryption key changes after every opcode because the result of the decryption feeds back into the crypto state. So even if two consecutive instructions are the same, they will have different byte values in the stream. You cannot look at the bytecode and pattern-match opcodes without running the decryption chain from the start.
Another thing: the bytecode pointer can move forward or backward. There is a direction flag that is randomized per VM instance. Some builds read bytecode left to right, others right to left. If you are trying to walk the stream manually and you assume it goes forward, you might be reading it backwards.
Opcode Table
Each VM instance gets its own opcode table. The table maps byte values to handler entry points. The mapping is randomized. Opcode 0x10 in one protected binary might mean "push dword from memory" and in another it might mean "bitwise xor." There is no fixed encoding.
The table is not just a flat array either. Multiple opcodes can point to the same handler but with different operand sizes or register targets. There are entries for every combination of operation, operand type (register, memory, immediate), and size (byte, word, dword, qword). The full table can have over a hundred entries.
On top of the randomized mapping, each opcode entry has its own cryptor for decrypting the operand values that follow it in the stream. So even the data after the opcode byte is encrypted, and the key is different per opcode type. This is layered encryption: first the opcode byte is decrypted with the stream cryptor, then the operand bytes are decrypted with the opcode-specific cryptor.
Handlers
The handlers are native x86 code. Each one implements a single VM operation. There are handlers for:
- Push/pop values to and from the virtual stack
- Arithmetic: add, sub, mul, div, and, or, xor, not, neg, shl, shr
- Comparisons and flag computation
- Memory reads and writes at various sizes
- Register loads and stores (moving values between the virtual register context and the stack)
- Control flow: conditional and unconditional jumps within the bytecode
- Native calls: transitioning out of the VM to call a real function
Each handler ends by reading the next opcode and jumping to the next handler. They do not return to a central dispatcher function. Instead, the dispatch logic is duplicated at the tail of every handler. This is called threaded dispatch. It is faster than a central loop because there is no indirect branch back to a single point, but it also means there is no single "dispatcher" you can set a breakpoint on.
Register Context
The VM maintains a virtual context that holds the values of all CPU registers. When a virtualized function starts, the entry stub pushes all register values onto the stack in a specific order. The VM then copies them into a context area on the virtual stack. Inside the VM, register operations read from and write to this context instead of real registers.
The register order in the context is also randomized. In one build, offset 0 might be EAX and offset 4 might be ECX. In another build they could be swapped. The VM uses an internal mapping to know which offset corresponds to which register, but an analyst looking at the context layout cannot assume any fixed ordering.
There is also a virtual flags register. After arithmetic and comparison operations, the handler computes the CPU flags (zero, sign, carry, overflow, etc.) and pushes them onto the virtual stack. Later handlers that need flags (conditional jumps) pop them off. This is how conditional branches work in the VM: the comparison sets virtual flags, then the branch handler checks them.
Native Transitions
Not everything can be virtualized. System calls, FPU instructions, SSE operations, and calls to external functions need to run as real x86 code. When the VM hits one of these, it has to transition out.
The transition is basically the reverse of the entry sequence. The VM spills all virtual register values back into real CPU registers by restoring them from the context. Then it executes the native instruction or call. After the native code returns, the VM saves the registers back into the context (since the native code might have changed them) and resumes interpreting.
For function calls, there are handlers for different calling conventions. The VM has to set up the stack correctly for stdcall, cdecl, fastcall, and x64 conventions. It reads the parameters from the virtual stack, places them where the calling convention expects, calls the function, and captures the return value.
Two VM Types
I found that VMProtect has two VM variants internally. There is a classic type and an advanced type. The classic type uses a one-byte opcode that indexes into a jump table for dispatch. It is simpler and more straightforward to analyze. The advanced type does not use opcodes at all. Instead, each bytecode instruction contains a relative offset directly to the handler code. The interpreter reads the offset, adds it to a base pointer, and jumps. There is no central jump table. This is a threaded dispatch model where each handler tail-chains directly to the next without going through a shared dispatcher. The advanced type is significantly harder to analyze because there is no opcode table to reconstruct.
Multiple VMs Per Function
A single protected function can use multiple VM instances simultaneously. Different basic blocks within the same function can be randomly assigned to different VMs, each with its own opcode table, register mapping, encryption keys, and bytecode direction. When execution crosses from one VM to another, a transition handler saves the context from the first VM and re-enters the second. This means that even after fully analyzing one VM instance, you have only decoded some of the function blocks. The rest are running on a completely different interpreter.
Entry and Exit
When a virtualized function gets called, execution hits a small native stub. This stub pushes all registers, sets up the VM context, initializes the crypto state with a per-function key, points the bytecode register at the start of the function-specific bytecode, and jumps into the first handler.
The entry stub itself is encrypted with a per-function cryptor. The key for this is baked into the stub during protection. On entry, the stub decrypts itself (or the loader has already decrypted it), sets up the initial state, and begins execution.
When the bytecode hits a return instruction, the VM writes all virtual register values back to real registers, adjusts the real stack pointer to account for whatever the function was supposed to do to the stack, and does a native return. From the caller point of view, it looks like a normal function returned.
Next
In part 5 I will cover the mutation engine. How VMProtect transforms the handler code itself and what the different protection modes (Mutation, Virtualization, Ultra) actually do to your binary.