The standard way to trace what a program does is to add instrumentation. Insert callbacks at branch points, log the taken path, analyze after the fact. Every fuzzer, every profiler, every CFI system for the last three decades has relied on some version of this approach.
Instrumentation changes what you are measuring. It pollutes caches. It introduces branches that were not there before. It shifts timing. And it either requires source code or the ability to rewrite the binary at some point. For closed-source targets, for kernel code, for JIT-compiled output, it gets complicated quickly.
Intel Processor Trace sidesteps all of that. The hardware records control flow directly from the CPU pipeline and writes compressed packets to physical memory. The program runs unmodified. No patching, no callbacks. I went through the architecture and the tooling in detail on both Linux and Windows. What follows is what I found worth writing down.
What Came Before
The two hardware trace mechanisms that existed before Intel PT are Last Branch Record and Branch Trace Store.
LBR keeps the last 16 to 32 branch pairs (source IP and destination IP) in a ring buffer of MSRs. Reading it is cheap, near-zero overhead, and it has been in x86 chips since the Pentium 4. The problem is obvious once you see it: 32 branches. For finding a hotspot or quickly seeing what called into a crash site it is fine. For tracing anything nontrivial, you are only seeing the tail end of execution and the rest is gone.
BTS writes a record for every branch to a memory buffer. Full trace. The problem is that BTS is synchronous with the execution pipeline: every write competes with the running code for memory bandwidth and TLB entries. Measured overhead in practice was 40x or worse. It was only useful for very short traces on quiet systems, and even then you had to be careful about what you concluded from data gathered under that kind of load.
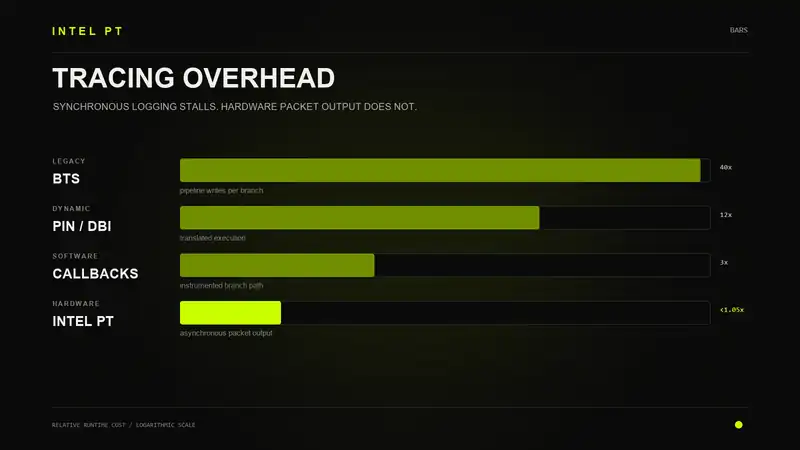
Intel PT landed with Broadwell in 2015 and addressed both problems. Low overhead because the write path is asynchronous and bypasses the normal cache hierarchy. Full trace because it was designed from the start to capture everything, just in a smarter format.
How the Trace Works
Most software execution is linear. Instructions run in sequence, unconditional jumps go to fixed targets, function calls go to known addresses. The only places where execution becomes ambiguous from the outside are conditional branches (which way did it go?) and indirect control flow (which target was taken?)
If you have a copy of the binary, you can reconstruct the full execution path by tracking just those two things. Walk the binary from the start, follow the instructions, and every time you hit a point of ambiguity, read the corresponding data from the trace to resolve it. You do not need to record every instruction. You just need to record the outcomes at the ambiguous points and let the decoder fill in the rest.
Intel PT works by monitoring branch retirement and emitting packets only at the ambiguous points. For a long run of sequential code with no branches, nothing is emitted. For a conditional branch, one bit gets recorded. For an indirect call whose target cannot be inferred statically, a target IP packet is emitted.
The consequence of this design is that a decoder cannot work from the packets alone. It needs the binary image. The packets are steering signals, not a standalone trace. Without the binary, you have a stream of compressed bits that means nothing.
The Packet Format
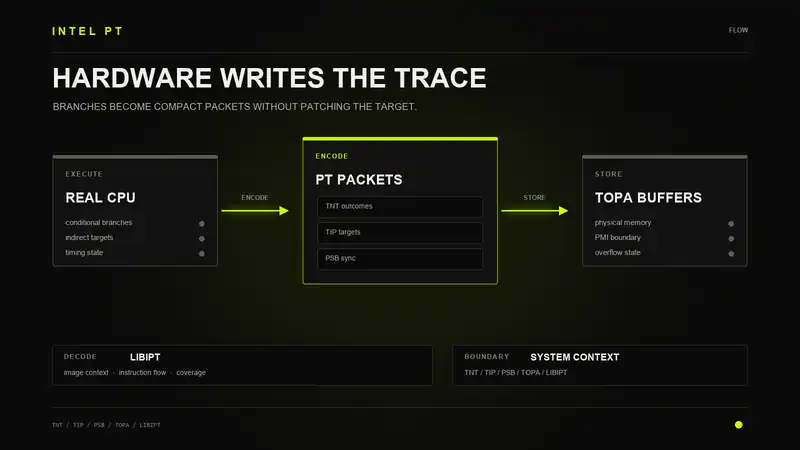
The most common packet is TNT (Taken/Not-Taken). It encodes the outcomes of conditional branches as bits: 1 for taken, 0 for not-taken. A short TNT packet fits up to six outcomes in a single byte. An extended TNT packet handles up to 47 outcomes across eight bytes. Six branches in one byte is very compact, and most hot code paths produce a lot of conditional branches, so TNT packets dominate the stream by count but not by byte volume.
TIP (Target IP) provides the destination address when static analysis cannot determine it: indirect calls, indirect jumps, returns from functions where the return address changed, and interrupt service entry points. The hardware compresses these by only sending the bytes that differ from the previously recorded IP. If the upper six bytes of a 64-bit address are unchanged from the last TIP packet, only the low two bytes go into the stream. The decoder tracks the running compressed IP and reconstructs the full address.
FUP (Flow Update Packet) is similar to TIP but marks an asynchronous event rather than a direct branch. When an interrupt fires or an exception occurs, the hardware emits a FUP with the IP of the interrupted instruction before the handler takes over. This lets the decoder identify exactly where the asynchronous event hit, not just that it happened. In the kAFL fuzzer, FUP combined with TIP is used to detect and filter interrupt events during kernel tracing. A FUP followed by TIP signals the interrupt; the decoder ignores everything until the corresponding iret.
PIP (Paging Information Packet) records changes to the CR3 register. When the scheduler switches to a different process, a PIP goes into the stream with the new CR3 value. The decoder uses these to track which address space the trace belongs to at any given point. Without PIP, a system-wide trace spanning multiple processes would be undecipherable.
PSB is a 16-byte synchronization marker, a fixed pattern of 0x02 0x82 repeated eight times. It appears at regular intervals (configurable, typically every 4KB of output) and gives a decoder a known-good starting point. If you are handed a partial buffer dump or the trace has corruption, you scan forward to the next PSB and start decoding from there. Without PSB synchronization, a single dropped byte would corrupt everything following it.
OVF is two bytes and means the internal hardware FIFO overflowed. Some packets were lost before they could be written to memory. The decoder has to resync at the next PSB. In practice, overflow indicates the output buffer configuration was too aggressive for the trace volume being generated.
The timing packets are CYC and TSC. TSC emits the current 64-bit timestamp counter value, synchronized to wall-clock time. CYC emits the number of cycles elapsed since the last CYC packet, encoded as a variable-length field: small deltas compress to one byte, larger ones expand. When both TSC and CYC are enabled you can reconstruct instruction-level execution timing, which is what tools like VTune and magic-trace use for nanosecond-precision profiling.
cyc_thresh in perf) limits how often the hardware emits a CYC packet and reduces the size penalty, at the cost of timestamp resolution.Configuring the Hardware
Everything in Intel PT is controlled through MSRs. The main one is IA32_RTIT_CTL at address 0x570. Writing to it enables or reconfigures the trace. The relevant bits:
- Bit 0 (
TraceEn): enables packet generation. Clear this to pause without losing configuration. - Bit 1 (
CYCEn): emit cycle count packets - Bit 2 (
OS): trace ring 0 code - Bit 3 (
User): trace ring 3 code - Bit 7 (
CR3Filter): only generate packets whenCR3matchesIA32_RTIT_CR3_MATCH; per-process filtering - Bit 8 (
ToPA): use a Table of Physical Addresses instead of a single output buffer - Bit 10 (
TSCEn): emit TSC timestamp packets - Bit 13 (
BranchEn): emit TNT and TIP packets. Disabling this gives you timing-only mode.
The initialization order matters. Write zero to IA32_RTIT_OUTPUT_MASK_PTRS (0x561) first, then set the base address, then write CTL with TraceEn set. Enabling the trace before the output address is valid is undefined behavior. On some silicon it produces a machine check; on others it silently goes nowhere.
For per-process filtering using CR3Filter, write the target process CR3 value to IA32_RTIT_CR3_MATCH (MSR 0x572) and set bit 5 in CTL. The hardware will then only generate packets when the running CR3 matches, which means only that process's user-space execution is traced, even during kernel code that handles its syscalls.
For IP range filtering, IA32_RTIT_ADDR0_A through IA32_RTIT_ADDR3_B (MSRs 0x580 through 0x587) define up to four address ranges. The A register is the range start, B is the end. These let you trace only specific functions or modules and ignore everything else, which cuts the output volume dramatically on large binaries. How many pairs are actually present is read from CPUID leaf 14H, not assumed.
The ToPA
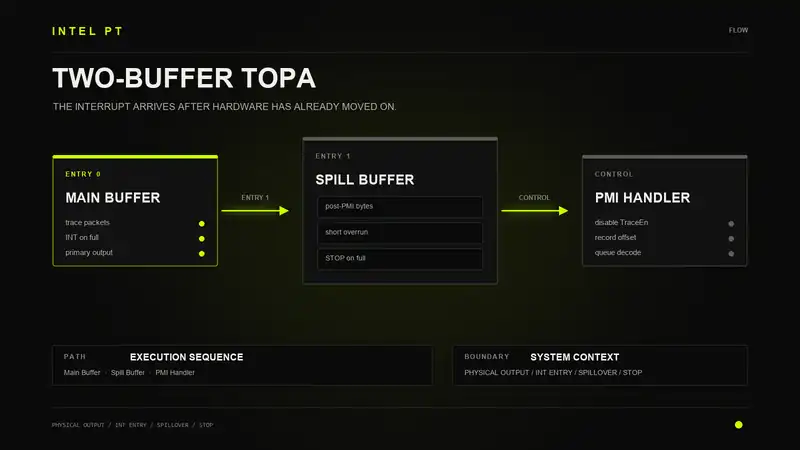
The output destination for trace packets is managed through a Table of Physical Addresses. It is a linked list of 8-byte entries, each pointing to a physically contiguous output buffer. The hardware walks the table as buffers fill.
Each ToPA entry packs several fields into 64 bits. The high bits hold the 4K-aligned physical address of the buffer. Bits 9:6 encode the buffer size as a power-of-two number of pages: 0 means 4KB, 1 means 8KB, and so on up to multi-megabyte allocations. Bit 4 sets INT mode, triggering a Performance Monitoring Interrupt when that entry fills, which lets a kernel driver copy the data out and reset the pointer. Bit 2 sets STOP mode, halting the trace when full. Bit 0 marks the last entry in the table.
For circular buffer mode (useful for post-crash analysis), configure a single ToPA entry with neither INT nor STOP and set the END bit pointing back to the first entry. The hardware wraps around and overwrites old data indefinitely. When a crash or event of interest occurs, you freeze the trace and decode backward from the current write pointer.
kAFL uses a two-entry setup: a main buffer with INT mode, and a smaller overflow buffer with STOP mode. When the main buffer fills, the interrupt fires and the hypervisor copies the data out. The PMI is not precise. The processor may continue writing a few more bytes after the interrupt fires before acknowledging it. The overflow buffer is sized to absorb that tail rather than losing it. When the main buffer fills faster than the interrupt can be serviced, the overflow buffer catches the extra data, then STOP halts the trace cleanly before anything wraps over the buffer boundary.
Getting Data Out
On Linux, the most accessible path is perf. Intel PT support landed in kernel 4.2. The basic recording invocation is:
perf record -e intel_pt//u -- ./targetThe //u suffix restricts to user-space. For kernel tracing: intel_pt//k. For cycle-accurate timing with maximum granularity: intel_pt/cyc,cyc_thresh=0/. To get the full instruction-level trace back out:
perf script --insn-trace --xed -F+srcline--xed requires Intel's XED disassembler to be built into perf. Without it, perf can still reconstruct branches but cannot print the full instruction stream. Building perf from the kernel tree with XED support is a two-step process: build and install XED first, then build perf.
For short-duration traces on specific code regions, the address filter option is the one to know:
perf record -e intel_pt//u --filter 'filter target_func @ ./binary' ./binaryThis tells the hardware to only enable PT when the IP is within target_func. The resulting trace is much smaller and faster to decode. Two other options worth having in muscle memory: noretcomp in the event string (intel_pt/cyc,noretcomp/) enables CYC timing at return instructions for better cycle-count accuracy. --kcore records kernel object code from /proc/kcore at trace time rather than reading from disk later. This matters when modules load and unload during the trace window, since their memory mappings change between recording and decoding.
For scenarios where perf is unavailable (embedded kernels, custom research setups), there is simple-pt, an experimental kernel driver and toolchain by Andi Kleen. It allocates trace buffers up to 8MB (constrained by kernel MAX_ORDER), provides a sideband file with process and symbol mappings, and decodes via its own version of libipt. For post-mortem panic analysis, loading the driver with start=1 print_panic_psbs=4 makes it log the trace to the kernel log as base64 on any kernel panic, recoverable with base64log.py and decodable with sptdecode.
perf binary in most Linux distributions is older than the running kernel. New PT features (PTWRITE support, newer timing modes, VM guest tracing) may not be in the packaged version. Build from the kernel source tree if you need them. Same goes for XED: the version baked into a packaged perf build may be too old to decode newer instruction encodings.For custom tooling that bypasses the perf CLI entirely, the raw kernel path is perf_event_open. Set attr.type to the integer read from /sys/bus/event_source/devices/intel_pt/type and call perf_event_open with the target PID. Then do two separate mmap calls: one for the DATA ring buffer (perf event records) and a second for the AUX area (raw PT packets). Both sizes must be powers-of-two page counts. Write the AUX offset and size into the perf_event_mmap_page header before the second mmap. The AUXTRACE records embedded in the resulting data carry the timing translation fields (time_shift, time_mult, time_zero) needed to map perf timestamps back to TSC values for the libipt sideband decoder.
Decoding with libipt
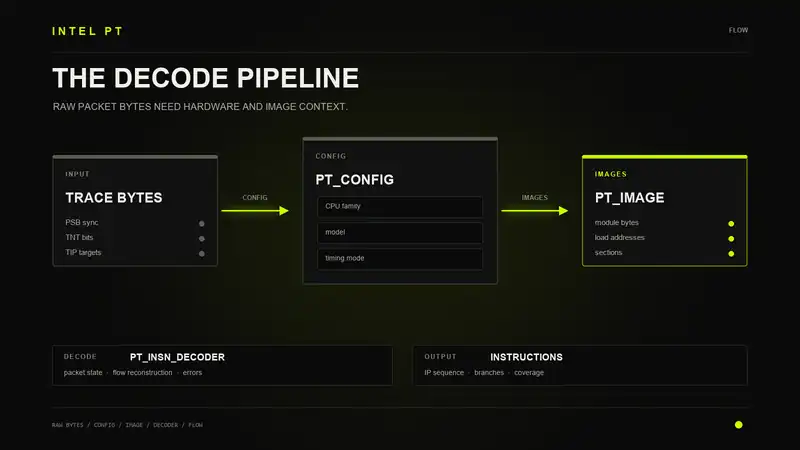
libipt is Intel's reference decoder. It is cross-platform, builds with cmake, and works on both Linux and Windows. The pipeline has three parts: describe the raw data and hardware characteristics in a pt_config, load the binary images into a pt_image, then drive a pt_insn_decoder to pull instructions out of the stream.
The config struct requires accurate CPU identification. The packet encoding has changed between microarchitecture generations, and the decoder uses the family/model/stepping to interpret ambiguous fields correctly. Get those from CPUID leaf 1 before setting up the config.
struct pt_config Cfg;
pt_config_init(&Cfg);
Cfg.begin = TraceBuffer;
Cfg.end   = TraceBuffer + TraceSize;
Cfg.cpu.vendor   = pcv_intel;
Cfg.cpu.family   = CpuFamily;   /* CPUID.1:EAX[27:20]|[11:8] */
Cfg.cpu.model    = CpuModel;    /* CPUID.1:EAX[19:16]|[7:4]  */
Cfg.cpu.stepping = CpuStepping; /* CPUID.1:EAX[3:0]          */

struct pt_image *Img = pt_image_alloc(NULL);
pt_image_add_file(Img, "/path/to/target", 0, UINT64_MAX, NULL, LoadBase);

struct pt_insn_decoder *Dec = pt_insn_alloc_decoder(&Cfg);
pt_insn_set_image(Dec, Img);

int Sync = pt_insn_sync_forward(Dec);
if (Sync < 0) {
    fprintf(stderr, "initial sync failed: %s\n", pt_errstr(pt_errcode(Sync)));
    goto Cleanup;
}

for (;;) {
    struct pt_insn Insn;
    int Status;

    while ((Status = pt_insn_next(Dec, &Insn, sizeof(Insn))) > 0) {
        /* positive return = events pending, insn still valid */
    }

    if (Status == -pte_eos)    break;
    if (Status == -pte_nosync) { pt_insn_sync_forward(Dec); continue; }
    if (Status < 0)            break;

    printf("%016llx  %s\n", (unsigned long long)Insn.ip,
           pt_iclass_name(Insn.iclass));
}
The loop structure above is the part that trips people. pt_insn_next returns a positive value when events (timing packets, trace enable/disable markers) are pending before the next instruction, but the Insn struct is still valid. You have to drain those by looping on positive returns before checking for errors. -pte_nosync means the decoder lost sync, which happens after an OVF packet. pt_insn_sync_forward scans ahead to the next PSB and resumes. -pte_eos is normal termination: trace buffer exhausted.
For multi-process traces, pt_image supports a callback interface (pt_image_set_callback) that fires every time the decoder needs code it has not seen yet, letting you load mappings on demand from a sideband file rather than pre-populating the image. This is how perf's own PT decoder handles process fork/exec events. The sideband records contain the mmap calls that tell you what binary is at what address at each point in time.
libipt is correct but not fast. For fuzzing use cases where the decoder runs between every single execution, the re-disassembly overhead becomes the bottleneck. kAFL's custom decoder runs 25 - 30× faster by caching the disassembly of each basic block. Once a block has been decoded, subsequent executions that hit the same block pull from the cache rather than re-disassembling.
Intel PT on Windows
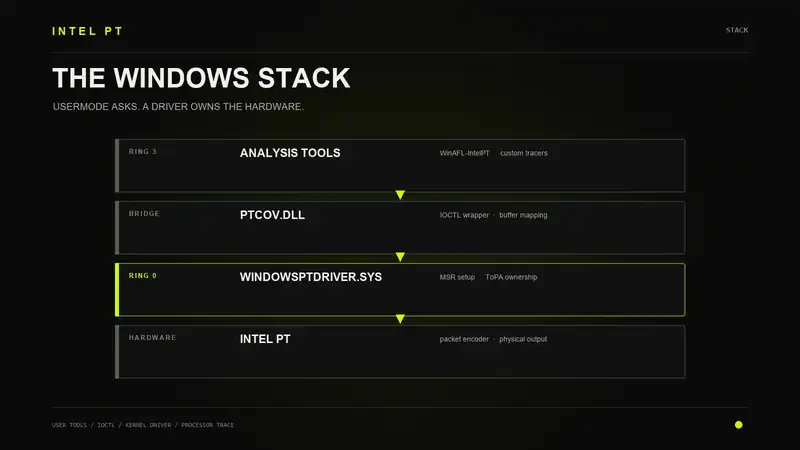
There is no perf on Windows. No perf_event subsystem, no AUX buffer mmap, no /sys/bus/event_source/devices/intel_pt. All of that is Linux infrastructure. On Windows, if you want Intel PT, you write a kernel driver or use one that already exists.
The driver that opened this up publicly was WinIPT, released by Richard Johnson from Cisco Talos at Black Hat 2017. It ships as two pieces: WindowsPtDriver.sys, a kernel-mode WDM driver that manages the hardware directly, and PtCov.dll, a userland library that communicates with it through DeviceIoControl. WinAFL-IntelPT builds on top of PtCov to bring hardware PT coverage to AFL on Windows targets.
The first practical problem the driver has to solve is physical memory. ToPA entries require physically contiguous buffers. Virtual contiguity is not enough, because the hardware is writing directly to the physical addresses packed into the ToPA table. On Windows, you get that with MmAllocateContiguousMemorySpecifyCache passing MmNonCached as the cache type. Cached mappings will either produce a machine check or silently generate garbage, because the PT hardware writes directly to DRAM and bypasses the CPU cache entirely. Extract the physical address afterward with MmGetPhysicalAddress and pack it into the ToPA entry.
PHYSICAL_ADDRESS PhysLowest  = { 0 };
PHYSICAL_ADDRESS PhysHighest = { .QuadPart = MAXLONGLONG };
PHYSICAL_ADDRESS PhysAlign   = { .QuadPart = PAGE_SIZE };

PVOID TopaVirtual = MmAllocateContiguousMemorySpecifyCache(
    TOPA_BUFFER_SIZE,
    PhysLowest,
    PhysHighest,
    PhysAlign,
    MmNonCached
);
if (!TopaVirtual) return STATUS_INSUFFICIENT_RESOURCES;

PHYSICAL_ADDRESS PhysAddr = MmGetPhysicalAddress(TopaVirtual);
PULONG64 TopaTable = (PULONG64)TopaVirtual;

TopaTable[0] = PhysAddr.QuadPart | ((ULONG64)SizeEncoding << 6) | (1ULL << 4);
TopaTable[1] = 0x1;

__writemsr(0x561, 0);
__writemsr(0x560, PhysAddr.QuadPart);
__writemsr(0x570, CtlValue);
MSR access in kernel mode is straightforward: __writemsr and __readmsr intrinsics work at IRQL ≤ DISPATCH_LEVEL. The initialization order is the same as on any platform: zero IA32_RTIT_OUTPUT_MASK_PTRS first, then write the base address, then set TraceEn in CTL. Before touching any of those, the thread must be pinned to the target logical CPU with KeSetSystemAffinityThread. PT MSRs are per-core. Without affinity pinning, your thread can migrate between the two wrmsr calls, and you configure a different core than the one your trace will run on.
The larger problem on modern Windows hardware is Virtualization Based Security. On Windows 10 and 11 with VBS enabled (the default on most OEM hardware since 2018), Secure Kernel intercepts certain MSR writes. Depending on the build and HVCI policy, writes to IA32_RTIT_CTL may silently succeed at the ring-0 level while the actual hardware MSR is left unchanged. The symptom is a trace buffer that stays empty with no error returned from wrmsr. To confirm VBS is the issue, check for VirtualizationBasedSecurity: Running in msinfo32, or look at the VirtualizationBasedSecurityStatus value under HKLM\SYSTEM\CurrentControlSet\Control\DeviceGuard. Disabling VBS (which also removes HVCI, Credential Guard, and related isolation) is the only reliable fix for a kernel research environment. Alternatively, run the target guest in a hypervisor where you control the VMCS directly, which is what kAFL does.
WinAFL-IntelPT is built for fuzzing environments where VBS is already off. The PtCovConfig structure exposed by the PtCov API accepts up to four module names as trace targets:
typedef struct _PtCovConfig {
    int   CpuNumber;
    DWORD TraceBufferSize;
    DWORD TraceMode;
    char *TraceModules[4];
    char **CovMap;
    int   CovMapSize;
    char *PtDumpPath;
} PtCovConfig;
The driver programs the IP range filter MSRs (IA32_RTIT_ADDR0_A/B through IA32_RTIT_ADDR3_B) to match the virtual address ranges of those modules. Tracing fires only when execution is inside those ranges, keeping the output small even when fuzzing a complex target loaded in a full process context. Persistent mode hooks the target function's entry, calls it repeatedly with AFL-generated inputs without restarting the process, and collects coverage between executions by reading the ToPA buffer through the driver IOCTL.
libipt itself builds on Windows without modification. From an x64 Developer Command Prompt: cmake -G "Visual Studio 17 2022" -A x64 .. followed by the normal build. ptdump and ptxed both work. The only difference from Linux is that you supply the raw PT bytes from the driver's output buffer rather than from a perf.data file, and the sideband information (which DLLs are loaded where) has to come from a parallel source: either the driver itself or a parallel ETW session capturing image-load events.
MmAllocateContiguousMemorySpecifyCache with MmNonCached can fail if the system has no contiguous physical region of the requested size available. This happens more often on fragmented systems. Allocate early during driver initialization, not on-demand. The driver's DriverEntry routine running at boot time sees the cleanest physical memory layout. Trying to allocate 4MB+ contiguous pages at runtime on a system that has been up for hours can fail silently.Coverage Fuzzing Without Source
The security application that pulled most of the research interest toward Intel PT is coverage-guided fuzzing of binaries you cannot recompile. AFL inserts callbacks at branch points during compilation. This works for open-source targets. For closed-source binaries, the kernel, firmware, or anything you cannot recompile, you either use QEMU full-system emulation or accept no coverage feedback at all.
PTfuzz, published in 2018, was an early demonstration of this. It reads the TNT packet stream from PT, converts the bit sequence of taken/not-taken outcomes into a coverage bitmap in the same format AFL uses, and feeds that into AFL's mutation engine. The binary gets coverage-guided fuzzing with roughly 15% overhead instead of 10 - 40x.
kAFL, from USENIX Security 2017, went further and targeted OS kernels. Fuzzing a kernel directly is hard for two reasons: crashes take the whole machine with them, and the fuzzer's own code gets traced along with the target. kAFL solved both by running the target kernel as a KVM guest and patching KVM to enable Intel PT only during guest execution.
The architecture has three components. KVM-PT is a KVM kernel module extension that uses the VMCS MSR autoload feature to swap PT configuration on every VM entry and VM exit. When the guest vCPU is running, PT is active and tracing only the guest kernel. When the guest exits to the host (for any reason, including the INT triggered by a full trace buffer), PT is automatically disabled before the host sees a single instruction. The hypervisor never appears in the trace.
QEMU-PT is the user-space counterpart that talks to KVM-PT via ioctl and mmap. It reads trace data directly from the mapped ToPA buffer and runs a custom decoder to produce an AFL-compatible coverage bitmap. The bitmap formula is (id(A)/2 ^ id(B)) % BITMAP_SIZE for each basic-block transition, where A and B are the source and destination block addresses. kAFL uses the actual basic-block addresses rather than compile-time random IDs, so no binary modification is needed.
Peak raw throughput on an i7-6700HQ reached around 17,000 executions per second against a simple lightweight kernel module specifically designed to measure fuzzer throughput. Real-world filesystem drivers ran slower: the Linux ext4 driver produced 3,000 to 5,700 executions per second depending on process count. Against the Windows NTFS driver, throughput dropped to 20 executions per second because mounting an NTFS volume through the VHD API is slow, but even at that rate the fuzzer found 59 unique crash inputs in 4 days and 14 hours. All were division-by-zero bugs in a path reachable from mounting a malformed volume. HFS+ (macOS) and EXT4 (Linux) produced kernel bugs within hours.
Using PT for Control-Flow Integrity
The same hardware that feeds fuzzers can be turned around for live defense. Control-Flow Integrity enforcement verifies that every indirect branch and return goes to a valid target. Traditional software CFI instruments the binary at compile time and inserts runtime checks. Hardware-based CFI can do it without modifying the binary at all.
Griffin, from ASPLOS 2017 (Microsoft Research), enforces CFI policies on unmodified user-space binaries using Intel PT. The core problem it had to solve is latency: there is an unavoidable delay between when packets are generated and when they are available for analysis. Griffin handles this by offloading the trace decoding and CFI checking to spare CPU cores, running the analysis in parallel with the program. The protected program runs on one set of cores while analysis workers decode its trace and check policy on others.
Griffin supports three CFI levels. Coarse-grained checks verify that indirect calls and jumps reach valid function entry points, catching most ROP attacks where the gadgets start mid-function. Fine-grained checks compare each branch against a static control-flow graph produced by analysis tools. Shadow stack enforcement uses PT's return packets to verify that every return goes to the instruction immediately after the corresponding call.
On Firefox, Griffin added 11.9% overhead on average. This includes JIT-compiled JavaScript, which Firefox's SpiderMonkey engine produces dynamically. Griffin handles JIT code through a custom feedback mechanism where the JIT engine notifies Griffin when new code is generated, allowing the CFI policy to be updated at runtime.
PT-CFI, a separate project from the same year, focused specifically on backward-edge protection (return instructions). By watching TIP packets for return targets and comparing them against a shadow return stack, it enforces that every return goes where it should. Under 5% overhead with zero false positives on the benchmarks tested. Returns are frequent but the verification is cheap: one lookup in the shadow stack per TIP packet decoded.
PTWRITE: Injecting Custom Data
Newer processors added a user-accessible way to write arbitrary data into the PT stream: the PTWRITE instruction. It takes a 32-bit or 64-bit operand and inserts it as a PTW packet into the active trace.
The DTrace data integrity system uses PTWRITE to extend PT's reach from control flow to data flow. Software instrumentation marks critical memory operations (loads and stores to security-sensitive variables like user IDs, permission bits, capability flags) with PTWRITE calls that inject the current value into the trace. The control flow and the data values are now in the same stream, time-synchronized by the hardware. An offline analyzer can reconstruct not just what the program did but what values it was operating on when it did it.
This matters because most exploitation techniques for the last decade have moved toward data-only attacks. Control flow stays valid (no gadget chains, no ROP, no code injection) but the attacker modifies a security variable directly through an out-of-bounds write or a use-after-free. A pure control-flow integrity system cannot detect this. DTrace can, because the data injection means any modification to a monitored variable shows up in the trace regardless of how it got there.
CPUID.(EAX=14H, ECX=0):EBX[4]. Ice Lake and later. Checking before use: executing PTWRITE on a processor that does not support it raises #UD.Precision Profiling
The performance engineering application of Intel PT is solving the latency outlier problem. Standard sampling profilers are good at finding code that is slow on average. They miss the rare events: one request out of ten thousand that takes 10x longer than normal due to a cache eviction, a TLB miss cascade, or a context switch at the wrong moment.
Intel VTune's Anomaly Detection mode uses PT in circular buffer mode. The trace runs continuously and overwrites old data. When execution time for an operation exceeds a configurable threshold, the trace is frozen at that point. The buffer contains the PT data for the entire period leading up to the anomaly. With TSC and CYC timestamps in the stream, VTune reconstructs exactly which instructions ran, how many cycles each took, and where the outlier time was spent.
magic-trace, developed for high-frequency trading analysis, renders this data as a call tree with nanosecond-level timing annotations on every function. It works on production binaries without recompilation, which matters when the instrumented binary behaves differently enough to mask the problem you are trying to find.
Tracing Virtual Machines
Hypervisor support for Intel PT determines whether the trace includes host code, guest code, or both. The two major open-source hypervisors handle this differently in ways that matter for security research.
KVM integrates with the Linux perf subsystem. When a vCPU is scheduled, KVM uses the VMCS MSR autoload feature (specifically the VM entry and VM exit MSR load lists) to swap the host PT configuration out and the guest PT configuration in on every VM entry. On VM exit, the swap reverses. This means the trace is attached to the vCPU's time on the physical core, not to the logical CPU. kAFL extended this with KVM-PT to expose a user-space ioctl interface for configuring and reading trace data from QEMU.
Xen runs directly on hardware without a host OS underneath. Its PT implementation goes through the Dom0 privileged domain, and because Xen can trace hypervisor transitions as well as guest execution, a system-mode trace in Xen can show the complete path: guest kernel → hypervisor → guest kernel, including any code in the Xen microkernel itself. For VM escape research this is the coverage you actually want, because the transition code is the attack surface.
Limits Worth Knowing
Intel PT does not handle self-modifying code cleanly. If a JIT engine or a packer overwrites code pages between when they are fetched for execution and when the decoder walks them, the decoder will be reading the wrong bytes for those addresses. The --kcore perf option helps with kernel module loading and patching by snapshotting kernel code at trace time. For user-space JIT, the program needs to expose its JIT metadata (which addresses map to which generated code) to the decoder. JPortal does this for the JVM with a Java agent that records JIT compilation events and feeds them into the libipt sideband, giving you fully decoded instruction traces through JIT-compiled Java code.
Buffer overflow causes silent data loss. If trace volume exceeds what the ToPA buffers can absorb (PMI handler too slow, buffers undersized for the workload), the hardware emits an OVF packet and drops data. The decoder has to resync at the next PSB, and everything between the drop and the sync is gone. For high-throughput workloads like kernel fuzzing, ToPA sizing and PMI latency are not secondary concerns.
The CR3 filter is per-logical-CPU, not per-process. On a multi-core system, you need to configure PT independently on each core the process might run on. Context switches between processes on the same core mean you briefly trace whoever is running, not just your target, unless CR3 filtering is active.
Intel PT is Intel-only. AMD has its own branch tracing (IBS, and newer Instruction Based Sampling extensions) but the packet format is entirely different and no toolchain bridges them. Code written against libipt and perf's PT infrastructure does not port to AMD without significant rework at the hardware interface layer.
CPUID.(EAX=07H,ECX=0):EBX[25] = 1 indicates PT support. Leaf EAX=14H gives the capability details: output options, IP filtering range count, which packet types the silicon supports. Not every processor that exposes PT supports the full feature set. PTWRITE, MTC, and the larger range filter counts were added in later microarchitectures.Ten years out from Broadwell, Intel PT is embedded in fuzzers, CFI systems, nanosecond profilers, JVM analyzers, and malware recorders. None of those look related until you notice they all need the same thing: a full account of what code ran, gathered without disturbing it. BTS got there first and was too slow to be useful. Intel PT got the write path right (asynchronous writes to physical memory, no cache involvement) and that was enough to make it stick.