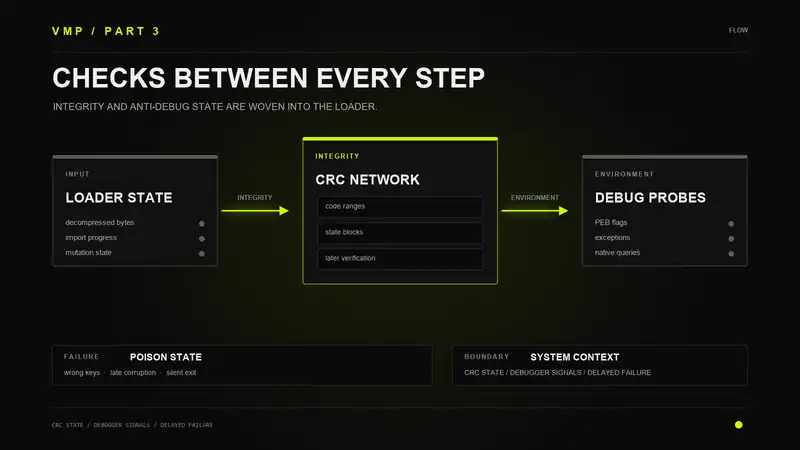
While the loader from Part 2 is decompressing sections and rebuilding imports, it is also running checks in between every step. These are not optional. They are woven into the sequence at specific points, running between decompression and import resolution, before and after fixups. If any of them trip, the binary either dies on the spot or silently poisons its own state so it breaks in weird ways later.
I went through all of them. There are three categories: integrity, debugger detection, and environment checks.
CRC Checks
VMProtect runs CRC checks at three levels. All three use the same CRC32 function and the same descriptor format: a region address, a size, and an expected hash. The descriptors are encrypted so you cannot just read them from the binary.
Loader CRC
This fires early, before decompression. The loader hashes its own code in memory and compares to an expected value. If someone patched the loader to skip a check or NOP something out, the hash will not match. Before checking individual regions it validates the check table itself. The table of CRC descriptors has its own hash, so removing entries from the table is also caught.
If the check fails and "check for patches" was enabled during protection, it shows an error and exits. If that option was off, it sets a flag in the obfuscated state block. The binary keeps running but the flag is there for the runtime to read later. What happens after that is up to how the developer set things up.
File CRC
This one checks the exe on disk, not the in-memory image. The loader opens its own file through the NT API (not the Win32 wrapper), creates a flat section mapping so it gets raw file bytes (not a parsed image mapping), and checksums specific regions. It also checks that the file size matches what was expected at protection time.
I think the reason for the flat mapping is to get around file system filter drivers or hooks that might intercept reads and return modified data. Mapping as a section object reads from the cache manager directly.
If someone patched the binary on disk, this will catch it.
Memory CRC
This runs near the end, after decompression is done and section data is in its final state. It hashes regions of the unpacked code in memory. If someone attached a debugger and patched code bytes after decompression, this catches it.
Before running the checks the loader does something I thought was clever. It queries the virtual memory layout around the image to make sure nobody extended the image allocation or inserted extra pages. It verifies the loader state block was not allocated from within the image address range, and that the page right after the image boundary does not share the same allocation base. Either condition would mean someone messed with the memory layout.
Anti-Debug
The debugger detection is not one check. It runs at multiple points in the loading process using different techniques each time. I will go through what I found.
PEB
The basic one. It reads the Process Environment Block from the segment register and checks BeingDebugged. Every debugger using the standard debug API sets this. Easy to bypass, but it is there.
Debug Port
It queries the debug port through an NT API call. If a debugger is attached through the kernel debug interface the port handle will be nonzero. Harder to fake than the PEB flag since it is a kernel-level check.
Debug Object Handle
This one tripped me up at first because the logic is backwards. It queries for the debug object handle, but on a normal process without a debugger this query should fail with a specific status code. If the query succeeds or returns zero, the loader treats it as suspicious. The idea is that on an undebugged process there should be no debug object, so a successful query means something is faking the response.
Thread Hiding
The loader tells the kernel to hide the current thread from the debugger. After this, the debugger stops getting debug events for this thread. Single-step and breakpoint exceptions go to the app-level exception handler instead. Does not detect a debugger but makes debugging a lot harder from that point on.
Breakpoint Scanning
Before calling NT API functions, the loader checks the first byte of the resolved address for 0xCC. That is the int3 opcode, meaning someone put a software breakpoint on the function. This runs on the memory protection API, the file mapping APIs, and others. It checks repeatedly throughout the process, not just once at the start.
Guard Pages
Every time the loader changes memory protections (twice per section, once to make writable and once to restore) it saves the old protection. If the old value had the guard page flag, someone put a guard page on that section. Debuggers use guard pages for memory access breakpoints. Since this check runs on every section, putting a guard page on any section trips it.
Trap Flag
This one I liked. The loader sets the trap flag in EFLAGS, then runs a couple instructions. Normally the trap flag fires a single-step exception after each instruction. The loader has an exception handler ready. Inside the handler it reads the debug registers DR0 through DR3. If any are nonzero, hardware breakpoints are set.
But there is a second thing going on. If the exception never fires, something is eating exceptions before they reach the handler. That is usually a debugger. So this one check catches both hardware breakpoints (through the debug registers in the handler) and debugger presence (by the exception not showing up at all).
Invalid Handle
The loader calls CloseHandle with a garbage handle value. Without a debugger, the call fails and returns an error. With a debugger, the kernel raises an exception on invalid handle close. How that exception gets handled or not reveals the debugger.
Kernel Debuggers
It also checks for kernel debuggers by querying system information for the kernel debugger status. On top of that it walks loaded kernel modules looking for known debugger driver names like SoftICE and Syser.
Environment Checks
VM Detection
If VM detection was enabled, the loader tries to figure out if it is in a virtual machine. It uses the trap flag trick again but this time it runs CPUID after setting the flag. On real hardware CPUID does not cause a VM exit and the single-step fires normally. On some hypervisors CPUID triggers an exit and the exception delivery can differ. The loader checks whether the exception context matches what it expects. If it does not, it flags a VM.
CPU Hashing
The loader grabs CPUID results from multiple leaves and combines them with the OS build number and a salt. These hashes go into the state block. They are not used for detection, but the licensing system can use them for hardware binding.
Syscall Resolution
During init the loader builds its own syscall number table. It has a hardcoded table that maps Windows build numbers to syscall numbers, from XP through Windows 11. If the build number is not in the table, it maps a clean copy of ntdll from disk (not the in-memory one that might be hooked) and extracts syscall numbers from the stubs. If it cannot figure out the build number at all, it treats that as suspicious.
This lets the loader bypass usermode hooks on ntdll. If something hooked NtProtectVirtualMemory or NtQueryInformationProcess, the loader goes straight to the kernel with a direct syscall and skips the hooks entirely.
State Block
All the detection results go into an obfuscated state block that gets allocated at the start. Each value is XORed with a unique salt so reading raw memory does not tell you if a debugger was found or if a CRC failed. The salts are baked into the loader as more placeholder constants that get patched in.
The block tracks patch detection, debugger detection, VM detection, a session key, CPU hashes, and the overall loader status. The VMProtect runtime reads these later and the developer can query them through the SDK to decide what to do.
Ordering
The thing that stood out to me most is where these checks sit in the loading sequence. They are not grouped together at the start or the end. Debugger checks run before decompression. CRC checks run between decompression and import resolution. More debugger checks run after imports. Memory CRC runs near the very end. You cannot just bypass the first round and call it done. The checks keep coming throughout the process and each round uses different techniques.