Hypervisors were designed to partition hardware: run multiple operating systems side by side, each believing it owns the machine. But the same mechanism that enables cloud computing also enables a class of malware called virtualization-based rootkits (VMBRs) - also known as hyperrootkits. Instead of running above the OS, these rootkits install beneath it, in VMX-root mode (Intel) or SVM-host mode (AMD). The operating system becomes a guest, and the rootkit becomes the hypervisor.
The enabler of this stealth is Second Level Address Translation (SLAT) - Intel's Extended Page Tables (EPT) and AMD's Nested Page Tables (NPT). SLAT was created to accelerate memory virtualization, but it also gives a hypervisor total control over what a guest OS sees. A hypervisor can present a clean, unmodified view of memory to integrity scanners while secretly executing modified code from a hidden page. The guest cannot tell the difference because every read, write, and execute goes through the hypervisor's translation tables.
I am going to stay close to mechanics here: how the second translation layer is built, where split-view memory tricks fit, which probes survive common spoofing, and what the existing tools actually check.
How SLAT Works
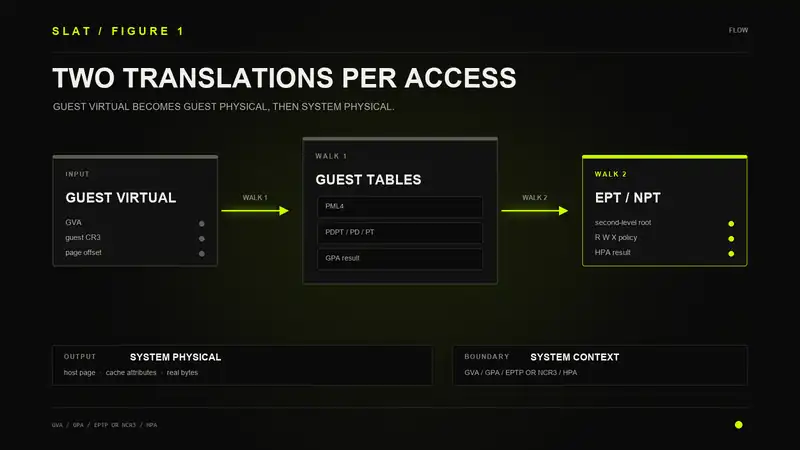
The Two-Level Translation Problem
In a non-virtualized environment, the OS manages page tables that map virtual addresses (VAs) to physical addresses (PAs). In a virtualized environment, there are two layers:
- Guest page tables - map guest VAs to guest physical addresses (GPAs), managed by the guest OS via
CR3. - SLAT tables - map GPAs to system physical addresses (SPAs), managed by the hypervisor.
Every memory access goes through both walks. The hardware does this automatically - no hypervisor intervention needed for normal accesses. The result is a two-dimensional page walk: the CPU traverses guest PML4 → PDPT → PD → PT, producing a GPA from each level, then traverses EPT PML4 → PDPT → PD → PT to resolve each GPA to an SPA.
Intel EPT Structure
EPT uses a 4-level (or 5-level with 5-level paging) radix tree identical in structure to x86-64 page tables. Each EPT entry contains:
| Field | Bits | Description |
|---|---|---|
| R (read) | 0 | Read access allowed |
| W (write) | 1 | Write access allowed |
| X (execute) | 2 | Execute access allowed |
| Page Frame Number | 12:51 | Physical address (4K-aligned) |
| Memory Type | 3:5 | Cacheability (UC, WC, WT, WB, WP) |
| Ignore PAT | 6 | Override PAT |
| Accessed | 8 | Set by hardware on access |
| Dirty | 9 | Set by hardware on write |
| Execute-only | 2 | Intel-specific: X=1, R=0, W=0 |
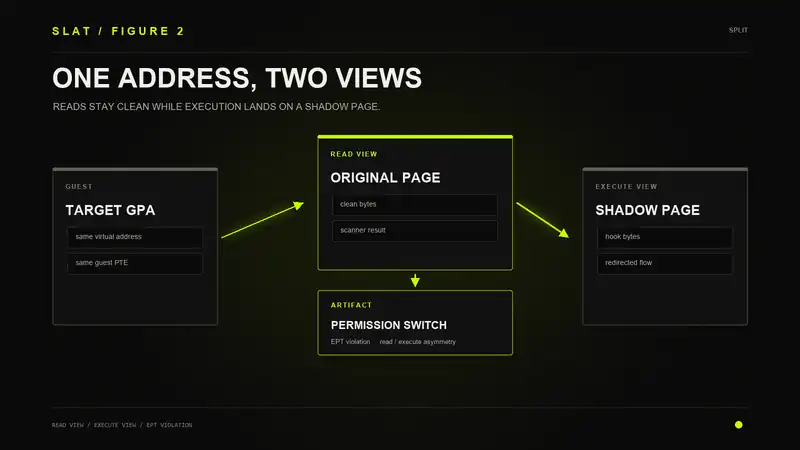
The critical architectural feature for stealth is execute-only pages: setting X=1 and R=W=0 allows code execution while making the page unreadable. Any attempt to read the page triggers an EPT violation, giving the hypervisor control.
AMD NPT Structure
AMD's NPT is functionally equivalent but with subtle differences:
- Permission granularity: R, W, X are not fully independent on all models - on some AMD CPUs, X implies R, making execute-only pages impossible.
- Fault mechanism: Nested page faults raise
#VMEXIT(NPF)withEXITINFO1distinguishing whether the fault occurred during a guest page-table walk or at the final GPA. - Context tagging: Uses Address Space Identifiers (ASIDs) instead of Intel's VPIDs.
VPID, ASID, and Tagged TLBs
To avoid flushing the TLB on every VM entry/exit, Intel uses Virtual-Processor Identifiers (VPIDs) and AMD uses ASIDs. These tags let the CPU cache translations for multiple address spaces simultaneously. A stealthy hypervisor:
- Assigns a non-zero VPID to the guest so guest and host TLB entries coexist.
- Uses selective invalidation (
INVVPIDtype 3 for CR3 writes,INVEPTfor specific EPT entries) instead of global flushes. - Avoids unnecessary TLB maintenance that would create measurable performance dips.
EPT Violation Path
When an EPT violation occurs (e.g., guest tries to read an execute-only page), the CPU:
- Saves the guest state to the VMCS.
- Loads the host state from the VMCS.
- Delivers control to the hypervisor's VM-exit handler.
- Records the exit reason (48 for EPT violation) and qualification in the VMCS.
The hypervisor can then inspect the qualification, determine which GPA caused the fault, and respond - by swapping EPT entries, injecting a fake value, or terminating the guest.
EPT Entry Bit-Level Breakdown
Each 64-bit EPT entry encodes more than just permissions. The full layout matters for both functionality and detection engineering:
| Bits | Name | Role in Stealth |
|---|---|---|
| 0 | Read access | Cleared to deny reads, triggering EPT violations for integrity scanners |
| 1 | Write access | Cleared to prevent guest modification of hooked pages |
| 2 | Execute access | Set alone (with R=W=0) for execute-only split-view hooking |
| 3:5 | Memory type | PAT-like cacheability: UC=0, WC=1, WT=4, WP=5, WB=6. Mismatched types between views cause timing side channels |
| 6 | Ignore PAT | Overrides guest PAT; set to 1 for predictable cache behavior in hooks |
| 7 | Reserved | Must be 0 |
| 8 | Accessed | Set by hardware on any access; can be monitored as a covert channel by SMM |
| 9 | Dirty | Set by hardware on write access |
| 10 | EPT exec-only | Intel-specific: enables execute-only pages. Cleared by AMD NPT |
| 12:51 | SPA page frame number | 44-bit physical address of the backing page. Swapping this field implements view switching |
| 52:63 | Reserved / protection key | Must be 0 for valid entries |
VMCS Fields: The Hypervisor's Control Surface
The Virtual Machine Control Structure (VMCS) is a 4KB-aligned memory region that controls every aspect of VMX operation. Understanding the critical fields reveals what a hypervisor can and cannot hide:
| VMCS Field | Encoding | Purpose | Detection Relevance |
|---|---|---|---|
| EPTP | 0x0000201A | EPT pointer: 12:51 = physical base of PML4, 0:2 = memory type, 3:5 = page walk length | Multiple EPTPs enable view switching; SMM can enumerate all valid EPTPs in the VMCS |
| EPT_POINTER | 0x0000201A | Same as EPTP, read-only alias | Comparing EPTP readback vs the active page tables reveals altp2m usage |
| VM_EXIT_CTLS | 0x00002036 | Which events cause VM-exits. Bits for CPUID, RDMSR, WRMSR, RDTSC, CR3, INVLPG, MOV-DR, I/O | A hypervisor that clears the RDTSC exit bit is not intercepting TSC - timing probes will be accurate |
| VM_ENTRY_CTLS | 0x0000203A | Controls for VM entry: load debug controls, load MSRs, inject events | Load IA32_EFER controls whether guest NX enforcement matches host expectations |
| TSC_OFFSET | 0x00002010 | Signed 64-bit offset added to guest RDTSC values | Primary mechanism for hiding VM-exit overhead; negative values = time stolen from guest |
| TSC_MULTIPLIER | 0x00002032 | Fixed-point multiplier for guest TSC (scaling) | Can accelerate or decelerate guest's perception of time; creates mismatch with HPET/PMTIMER |
| CR0_READ_SHADOW | 0x00006004 | Shadow value returned when guest reads CR0 | If CR0 doesn't match actual control register state, SMSW/LMSW emulation becomes inconsistent |
| CR4_READ_SHADOW | 0x00006006 | Shadow value returned when guest reads CR4 | Mismatch between shadow and actual CR4 causes detection via instruction behavior divergence |
| VMCS_LINK_POINTER | 0x00002800 | Links to shadow VMCS for nested virtualization | Non-null value indicates nested virtualization is in use (Blue Pill / DroidStone technique) |
The VMCS is itself a detection surface. A hypervisor that virtualizes MSRs must also virtualize the VMX capability MSRs (0x480-0x493) to maintain consistency. If IA32_VMX_BASIC (0x480) reports VMCS revision ID X but the actual VMCS in use has revision Y, the discrepancy exposes the hypervisor.
The Hypervisor Attack Surface
What a Hypervisor Can Intercept
A hypervisor running beneath the OS can intercept:
| Resource | Interception Method | Evasion |
|---|---|---|
| CPUID leaves | VM-exit on CPUID | Return spoofed values |
| MSR access | VM-exit on RDMSR/WRMSR | Mask virtualization MSRs |
| Memory reads/writes | EPT permissions | Execute-only pages |
| CR3 writes | VM-exit on MOV CR3 | Track page tables |
| Interrupts | APIC virtualization | Synthesize guest APIC state |
| RDTSC/TSC | TSC offsetting/scaling | Hide VM-exit overhead |
| I/O ports | VM-exit on IN/OUT | Emulate or passthrough |
Memory Cloaking via EPT
The split-view technique exploits execute-only EPT entries. The hypervisor:
- Allocates a shadow page containing its hook code.
- Creates an EPT mapping for the target GPA that points to the shadow page, marked X-only.
- Keeps the original page mapped elsewhere for read/write access.
- When the guest executes the address → CPU succeeds (X bit set).
- When an integrity scanner reads the address → EPT violation → hypervisor swaps the EPT entry to the original page, returns the clean content, then re-applies the hook.
View Switching via altp2m / Multiple EPTPs
Intel supports multiple EPT pointers (EPTPs) in the VMCS. Technologies like Xen's altp2m allow up to 512 memory views per guest. Switching views is near-instantaneous - just change the EPTP index. This avoids the overhead of EPT entry modifications and TLB invalidations.
A stealthy rootkit can maintain separate views: one for normal operation, one for intercepted syscalls, and one for hiding its own kernel module.
Historical Context: The Evolution of Hypervisor Rootkits
The progression from theory to weaponized hypervisor stealth tracks the evolution of hardware virtualization itself:
| Year | Project | Significance |
|---|---|---|
| 2005 | Intel VT-x / AMD-V silicon | Hardware virtualization becomes available on consumer CPUs, eliminating the need for binary translation |
| 2006 | SubVirt (King et al., Microsoft/UMich) | First academic proof-of-concept: installs a VMM beneath a running OS, hides malware from the guest. Demonstrated that the guest OS cannot detect ring -1 compromise through in-guest tools |
| 2006 | Blue Pill (Rutkowska, COSEINC) | Demonstrated on-the-fly migration of a live Windows OS into a VM without reboot. Used AMD SVM. Introduced the concept that ring -1 changes the evidentiary model - guest-visible bytes are not trustworthy |
| 2009 | Vitriol (Rutkowska) | Intel VT-x version of Blue Pill. Demonstrated EPT-based page remapping for stealth. First practical use of EPT execute-only pages for memory hiding |
| 2011 | Stoned Bootkit / Mebromi | Real-world BIOS-level bootkit that installed a hypervisor. Combined MBR infection with VMX rootkit. Marked the transition from research to in-the-wild malware |
| 2015 | DroidStone (Peking University) | Nested hypervisor hiding: a hypervisor that virtualizes itself, making detection by a higher-privilege layer harder. Demonstrated on ARM/Android |
| 2017 | kAFL (USENIX Security) | Hardware-assisted kernel fuzzing using Intel PT. Though defensive, it proved that hypervisors can be instrumented for security monitoring - closing the loop |
| 2019 | Ophion stealth hypervisor | Modern VT-x rootkit: EPT large-page identity mapping, firmware-locked MSR masks, TSC trapping, and VMFUNC view switching. Represents the state of the art in stealth |
| 2020 | HyperLeech (RAID) | DMA-based hypervisor injection via PCIe. Bypasses IOMMU on misconfigured systems. Introduced the threat of external-attacker hypervisor installation without kernel code execution |
| 2023+ | Intel TDX / AMD SEV-SNP | Confidential computing: the hypervisor is removed from the trust boundary. Guest memory is encrypted and integrity-protected. Shifts the threat model entirely |
Stealth Techniques
CPUID and MSR Masking
The most basic detection vector is the CPUID hypervisor bit (ECX bit 31 of leaf 1). A legitimate hypervisor sets this to 1, but a stealthy one clears it:
// Hypervisor's CPUID handler for leaf 1
void handle_cpuid_leaf1(guest_state* g) {
    g->eax = read_native_cpuid(1, 0);  // pass through
    g->ebx = read_native_cpuid(1, 0);
    g->ecx = read_native_cpuid(1, 0) & ~BIT31;  // clear hypervisor bit
    g->edx = read_native_cpuid(1, 0);
}
For MSRs, the hypervisor must:
IA32_FEATURE_CONTROL(0x3A): Report VMX locked/disabled by firmware.- VMX capability MSRs (0x480-0x493): Pass through real hardware values for coherence.
- Synthetic MSR range (0x40000000+): Inject
#GPto avoid identification as Hyper-V, KVM, or Xen.
void handle_rdmsr(guest_state* g) {
    switch (g->rcx) {
    case IA32_FEATURE_CONTROL:
        g->rax = IA32_FEATURE_CONTROL_LOCK_BIT;  // locked, no VMX
        break;
    case 0x40000000 ... 0x4000FFFF:  // synthetic range
        inject_gp(g, 0);  // pretend MSR doesn't exist
        break;
    default:
        g->rax = native_rdmsr(g->rcx);  // pass through
        break;
    }
}
TSC Compensation
VM exits cost hundreds to thousands of cycles. A bare-metal CPUID takes ~80 cycles; in a VM, the exit/entry penalty adds measurable overhead. TSC offsetting and scaling can hide this:
Advanced rootkits like Ophion use a "trap next RDTSC" strategy: on a CPUID exit, the handler arms a trap for the next RDTSC instruction. When the guest measures elapsed time, the hypervisor returns a spoofed value matching bare-metal expectations.
Nested Virtualization (Blue Pill, DroidStone)
A hypervisor can install another hypervisor beneath itself, creating a nesting loop. Blue Pill (2006) demonstrated on-the-fly migration of a live OS into a VM without rebooting. DroidStone showed a hypervisor that virtualizes itself, making detection even harder:
┌─────────────────────────┐
│      Guest OS           │ ← Can detect the inner hypervisor
├─────────────────────────┤
│   Inner Hypervisor      │ ← May be detected by nested checks
├─────────────────────────┤
│   Outer Hypervisor      │ ← Undetectable from guest
├─────────────────────────┤
│      Hardware           │
└─────────────────────────┘
Intel Processor Trace (PT) Evasion
Intel PT records control-flow metadata. A hypervisor can:
- Disable PT on VM-entry by clearing
IA32_RTIT_CTL.TraceEn. - Use PT's FilterEnable and FilterEn to exclude hypervisor code from tracing.
- Configure
RTIT_CTLto stop tracing on VM-exit.
// Disable PT before VM-entry
vmcs_write(VM_ENTRY_CTLS, vmcs_read(VM_ENTRY_CTLS) | VM_ENTRY_LOAD_RTIT_CTL);
wrmsr(IA32_RTIT_CTL, 0);  // clear TraceEn before entering guest
APIC Virtualization (APICv / x2APIC)
APICv reduces VM exits for interrupt operations, which both improves performance and reduces detection surface. With APICv:
- Guest writes to the APIC page do not cause VM exits (they update a shadow page).
- The hypervisor can defer interrupt injection.
- Fewer exits = less timing variance = harder to detect.
Detection Methods
Taxonomy of Detection Techniques
| Category | Method | What It Detects | Reliability |
|---|---|---|---|
| Architectural | CPUID bit check | Hypervisor presence | Low (trivially spoofable) |
| Architectural | CPUID vendor string | Hyper-V, VMware, KVM, Xen | Medium |
| MSR-based | Synthetic MSR probe | Hyper-V/KVM enlightenments | Medium |
| Timing | RDTSC delta around CPUID | VM exit overhead | Medium |
| Timing | Statistical IET analysis | Variance/kurtosis anomalies | High |
| Memory | EPT hook scan | Execute-only page anomalies | High |
| Memory | TLB profiling | Nested page walk overhead | Medium |
| Microarchitectural | RSB (Return Stack Buffer) | Hypervisor stack pollution | High |
| Microarchitectural | Cache contention | Hypervisor code footprint | High |
| Performance monitor | PMU/HPC counters | Stolen cycles, ITLB flushes | Medium |
| SMM / out-of-band | External DMA read | Ground-truth memory view | Very high |
| Software | Driver name scanning | VM guest drivers | High |
| Software | Shared page check | NtQuerySystemInfo(0xC5) | High |
CPUID Discrepancies
The simplest check: query CPUID leaf 1 and check ECX bit 31.
int cpuinfo[4] = {0};
__cpuid(cpuinfo, 1);
int hypervisor_bit = (cpuinfo[2] >> 31) & 1;
Limitation: a stealthy hypervisor simply clears this bit. More useful: check for inconsistencies between leaves. For example, if CPUID leaf 0xD subleaf 0 and subleaf 1 return identical values, the hypervisor is ignoring ECX - a sign of lazy emulation.
Timing Analysis
RDTSC delta: Measure the cycles for a CPUID instruction (which causes a VM exit).
uint64_t t1 = __rdtsc();
__cpuid(cpuinfo, 0);
uint64_t t2 = __rdtsc();
uint64_t delta = t2 - t1;
// Bare metal: ~80-200 cycles
// Virtualized: ~1000-5000 cycles (even with TSC compensation)
Statistical Instruction Execution Time (IET): Even if the hypervisor spoofs the mean, it cannot hide the variance. VMM dispatcher logic adds randomness:
| Metric | Bare Metal | Virtualized (stealthy) |
|---|---|---|
| Mean CPUID | ~80 cycles | Spoofed to ~80 |
| Variance | Extremely low | Higher (dispatcher noise) |
| Spectral width | Narrow | Broad/layered |
| Outlier pattern | Random (interrupts) | Periodic (VMM dispatcher) |
The Wilcoxon rank-sum test can reject the null hypothesis ("this is bare metal") with high confidence from a few thousand samples.
TLB and Translation Profiling
Nested paging multiplies page-table walk latency. Bare-metal TLB miss penalty is ~5x the hit latency; with EPT/NPT, it exceeds 10x:
// Measure TLB-friendly (sequential, 64B stride) vs TLB-unfriendly (sparse 64KB stride)
for (int i = 0; i < 10000; i += 64) {
    t1 = __rdtsc();
    *(volatile char*)(region + i) = 0x42;
    t2 = __rdtsc();
    hit_latencies.push_back(t2 - t1);
}
for (size_t i = 0; i < alloc_size; i += 4096 * 16) {
    t1 = __rdtsc();
    *(volatile char*)(region + i) = 0x42;
    t2 = __rdtsc();
    walk_latencies.push_back(t2 - t1);
}
double ratio = mean_walk / mean_hit;
bool is_vm = (ratio > 10.0);  // threshold
RSB (Return Stack Buffer) Probing
The Hyper-channel technique: populate the RSB with known return addresses, trigger a VM-exit (e.g., CPUID), then time a sequence of RET instructions. If the hypervisor's exit handler used the stack, it polluted the RSB, causing misses:
void hyper_channel_probe() {
    // Train RSB with known addresses
    asm volatile("call train; ret; train: ...");
    // Trigger VM exit
    __cpuid(cpuinfo, 0);
    // Measure RET timing - miss = ~15 cycles penalty
    t1 = __rdtsc();
    asm volatile("ret" : ...);
    t2 = __rdtsc();
    // High delta → RSB was polluted → hypervisor present
}
Hardware Performance Counter Monitoring
The PMU gives another view of the machine. The counters I would start with are:
- ITLB misses: View switching causes ITLB flushes.
- L3 cache misses: Hypervisor code thrashes shared cache.
- Instructions retired vs cycles: Ratio reveals stolen cycles.
// Configure PMU to count ITLB misses
wrmsr(IA32_PERFEVTSEL0, EVENT_ITLB_MISS);
// Run probe
uint64_t before = rdpmc(0);
probe_function();
uint64_t after = rdpmc(0);
uint64_t misses = after - before;
if (misses > threshold) { /* likely virtualized */ }
SMM and External Introspection
System Management Mode (SMM) runs below the hypervisor. An SMM monitor can:
- Periodically trigger an SMI to freeze the system.
- Read the hypervisor's code and EPT structures from physical memory.
- Compare a guest's self-reported state against the SMM view.
External DMA (PCIe forensic cards) reads physical memory without CPU involvement, immune to hypervisor spoofing.
Cache Contention Probing
Caches are shared between the hypervisor and the guest. A hypervisor's VM-exit handler occupies cache lines during dispatch. A detector can:
- Prime: fill a cache set with known data from the guest.
- Trigger: cause a VM-exit (CPUID, RDMSR to synthetic range).
- Probe: measure access latency to the cached data. If latency increased, the hypervisor evicted those lines.
// Prime+Probe cache contention across VM-exit boundary
uint64_t probe_cache_contention() {
    static char buffer[64 * 256];  // one cache set worth

    // Prime: fill target cache set
    for (int i = 0; i < 256; i++) {
        *(volatile char*)(buffer + i * 64) = 0xAA;
    }

    // Trigger VM-exit
    __cpuid(cpuinfo, 0);

    // Probe: measure access latency
    uint64_t t1 = __rdtsc();
    for (int i = 0; i < 256; i++) {
        *(volatile char*)(buffer + i * 64) = 0xBB;
    }
    uint64_t t2 = __rdtsc();

    return (t2 - t1) / 256;  // average cycles per access
    // Bare metal: ~3-4 cycles (L1 hit)
    // Post-VM-exit: >10 cycles (L1 miss, L2/L3 hit)
}
The technique is probabilistic - one sample is useless. Statistical significance requires hundreds of iterations. The noise floor from interrupts and context switches must be accounted for. But when tuned correctly, cache contention is one of the hardest signals for a hypervisor to mask because the hypervisor must use the cache to run its exit handler at acceptable speed.
PMU Counter Virtualization Detection
Modern hypervisors can virtualize PMU counters via the VMCS's PMU_VIRTUALIZATION controls. A detector can probe for counter virtualization by:
// Write known value to PMC0, read back, check if it stuck
wrmsr(IA32_PMC0, 0xDEADBEEF);
uint64_t val = rdpmc(0);
if (val != 0xDEADBEEF) {
    // Counter virtualization intercepted the write
    return DETECTED;
}

// Write to counter config, check if enable bit retained
wrmsr(IA32_PERFEVTSEL0, COUNTER_ENABLED | EVENT_INSTRUCTIONS_RETIRED);
uint64_t cfg = rdmsr(IA32_PERFEVTSEL0);
if (!(cfg & COUNTER_ENABLED)) {
    // Hypervisor stripped the enable bit - counter is dead
    return DETECTED;
}
hvdetecc expands on this by checking whether multiple counter access paths agree: MSR readback, RDPMC instruction, and actual counter behavior (enabled counter should increment). Disagreement between any two of these reveals counter virtualization.
Case Study: Multi-Pass Driver Scan & SharedPage Check
Driver Name Scanning
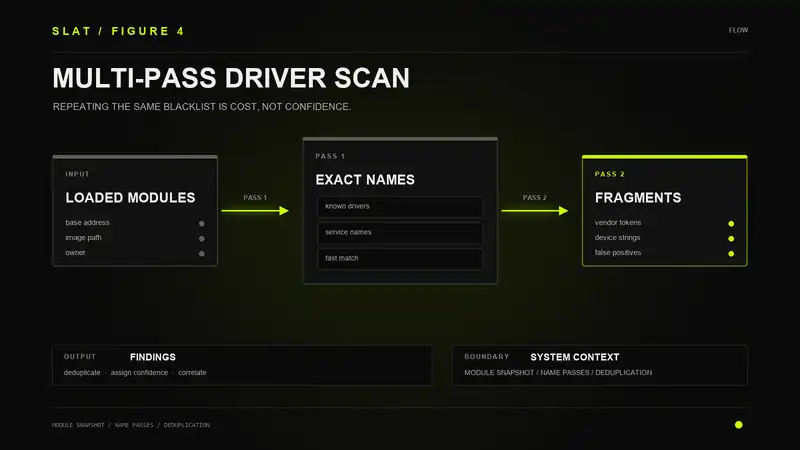
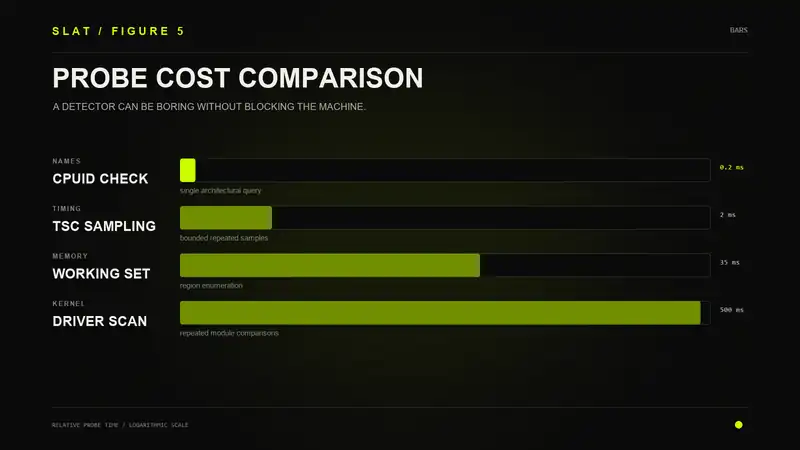
Some commercial integrity scanners implement a brute-force approach to virtual machine detection. At load time, the scanner makes 10+ full passes over the kernel's loaded module list. Each pass searches for a specific blacklisted driver name using RtlCompareString. Across all passes, this amounts to approximately 4,674 string comparisons.
Blacklisted VM platform drivers:
| Driver | Vendor | Platform |
|---|---|---|
VBoxGuest.sys | Oracle | VirtualBox guest additions |
VBoxVideo.sys | Oracle | VirtualBox virtual display |
vm3dmp.sys | VMware | VMware 3D display miniport |
prl_kmdd.sys | Parallels | Parallels kernel-mode display |
HyperVideo.sys | Microsoft | Hyper-V synthetic video |
vrd.sys | Microsoft | Virtual Remote Desktop display |
viostor.sys | Red Hat | VirtIO/KVM/QEMU storage |
vioscsi.sys | Red Hat | VirtIO/KVM/QEMU SCSI |
Blacklisted debugging and inspection drivers:
| Driver | Target |
|---|---|
Dbgv.sys | Kernel debugger (DbgView/SoftICE) |
PROCMON23.sys | Process Monitor |
dbk64.sys | Low-level memory inspection driver |
Detection logic (conceptual):
// Simplified module scanning - 10 passes, one driver per pass
typedef struct _SYSTEM_MODULE_INFO {
    HANDLE  Section;
    PVOID   MappedBase;
    // ...
    WCHAR   ImageName[256];
} SYSTEM_MODULE_INFO, *PSYSTEM_MODULE_INFO;

const wchar_t* blacklist[] = {
    L"VBoxGuest.sys", L"VBoxVideo.sys", L"vm3dmp.sys",
    L"prl_kmdd.sys", L"HyperVideo.sys", L"vrd.sys",
    L"viostor.sys",  L"vioscsi.sys",
    L"Dbgv.sys",     L"PROCMON23.sys", L"dbk64.sys"
};

bool scanner_vm_detect() {
    for (int pass = 0; pass < 10; pass++) {
        // Query loaded module list
        PSYSTEM_MODULE_INFORMATION mods = query_modules();

        for (ULONG i = 0; i < mods->Count; i++) {
            if (RtlCompareString(
                    mods->Modules[i].ImageName,
                    blacklist[pass],
                    TRUE) == 0) {
                return TRUE;  // VM DETECTED
            }
        }
    }
    return FALSE;
}
Strengths:
- Detects VMs by identifying drivers that the VM installs as guest additions.
- Multiple passes ensure the driver hasn't been unloaded between checks.
- Simple and effective against standard VM configurations.
Weaknesses:
- A stealth hypervisor can hide the driver from the loaded module list by intercepting
NtQuerySystemInformation(SystemModuleInformation)and filtering out blacklisted names. - The driver list is static - renaming a driver defeats this check.
- Performance cost: ~500ms for the full 10-pass scan.
Evasion by a rootkit hypervisor:
A hypervisor-level rootkit can intercept the NtQuerySystemInformation system call (class 0x0B, SystemModuleInformation) via an EPT hook on ntoskrnl.exe's system service dispatch. When the class matches module information:
// Hypervisor-side interception of module info query
void hv_intercept_module_query(guest_regs* regs) {
    // Let the query proceed normally
    // Then walk the returned module list and remove entries
    // matching blacklisted driver names

    SYSTEM_MODULE_INFORMATION* info = (SYSTEM_MODULE_INFORMATION*)regs->rsi;
    for (int i = 0; i < info->Count; i++) {
        if (is_blacklisted(info->Modules[i].ImageName)) {
            // Remove this entry by compacting the list
            memmove_s(&info->Modules[i],
                      &info->Modules[i+1],
                      (info->Count - i - 1) * sizeof(info->Modules[0]));
            info->Count--;
            i--;
        }
    }
}
SystemHypervisorSharedPageInformation (NtQuerySystemInformation Class 0xC5)
Windows 10 and later expose the hypervisor's shared page through a user-mode-accessible system information class. The call:
// Query class 0xC5: SystemHypervisorSharedPageInformation
SYSTEM_HYPERVISOR_SHARED_PAGE_INFORMATION info = {0};
NTSTATUS status = NtQuerySystemInformation(
    (SYSTEM_INFORMATION_CLASS)0xC5,  // SystemHypervisorSharedPageInformation
    &info,
    sizeof(info),
    NULL
);
Returned structure:
typedef struct _SYSTEM_HYPERVISOR_SHARED_PAGE_INFORMATION {
    PSYSTEM_HYPERVISOR_USER_SHARED_DATA HypervisorSharedUserVa;
} SYSTEM_HYPERVISOR_SHARED_PAGE_INFORMATION, *PSYSTEM_HYPERVISOR_SHARED_PAGE_INFORMATION;
Detection logic:
bool is_hypervisor_exposed() {
    SYSTEM_HYPERVISOR_SHARED_PAGE_INFORMATION info = {0};
    NTSTATUS status = NtQuerySystemInformation(
        (SYSTEM_INFORMATION_CLASS)0xC5, &info, sizeof(info), NULL);

    if (NT_SUCCESS(status) && info.HypervisorSharedUserVa != NULL) {
        // A hypervisor has mapped its shared page into user space
        // This indicates a type-1 hypervisor (Hyper-V, etc.)
        return TRUE;
    }
    return FALSE;
}
Interpretation:
HypervisorSharedUserVa != NULL: A hypervisor has mapped its shared page into user space. The page containsSYSTEM_HYPERVISOR_USER_SHARED_DATAwith timing lock, multiplier, and bias for high-resolution QPC.HypervisorSharedUserVa == NULL: Either bare metal, or a hypervisor that deliberately hides this page.
How a stealthy hypervisor can hide this:
The NtQuerySystemInformation system call with class 0xC5 reads a pointer stored in the kernel's ntoskrnl.exe data section. A stealth hypervisor can:
- Intercept the system call dispatch via an EPT hook: when
rax = NtQuerySystemInformationandrcx = 0xC5, patch the output buffer to zero out the pointer. - Modify the kernel data structure that stores the shared page pointer (e.g.,
ExpHypervisorSharedUserVa) to be NULL. - Never populate the shared page - if the hypervisor never calls
HvlMapSharedUserVa, the pointer stays NULL.
// Hypervisor-side: intercept NtQuerySystemInformation class 0xC5
void hv_intercept_shared_page_query(guest_regs* regs) {
    SYSTEM_INFORMATION_CLASS class = (SYSTEM_INFORMATION_CLASS)regs->rdx;
    if (class == (SYSTEM_INFORMATION_CLASS)0xC5) {
        // Let the query execute normally
        // Then zero out the return pointer
        regs->r8 = 0;  // NULL in the output buffer
    }
}
Tool Analysis
Bloodhound
Source files: Bloodhound.cpp, VPGATHER.cpp
Method: Bloodhound uses the VPGATHERQQ instruction (AVX2) to test address accessibility without actually causing a page fault. It:
- Locates a
RET(0xC3) instruction in the target page. - Executes the
RETto force an EPT violation (if the page is hooked). - Uses
VPGATHERQQto check if the address is still accessible after execution. - Repeats 100 times; if confidence >= 90%, declares an EPT hook present.
Key insight from VPGATHER.cpp:
// VPGATHERQQ: if the test address faults, the #DB handler
// detects the second single-step on the same instruction
// and sets TlsAddressNotValid = TRUE
__m128i Addresses = _mm_set_epi64x((UINT64)Address, (UINT64)ValidRegion);
TlsAddressNotValid = FALSE;
__debugbreak();  // Start single-stepping
_mm_i64gather_epi64(NULL, Addresses, 1);  // VPGATHERQQ
Strengths: Novel use of VPGATHERQQ to probe address accessibility without page faults. Executing a RET is low-side-effect - it doesn't corrupt guest state.
Weaknesses: Requires AVX2 support. The 100-iteration loop is noisy. Only detects EPT hooks based on execute/read asymmetry - may miss hooks that use NPT or shadow pages with full R/W/X.
VPGATHERQQ mechanism in depth:
The VPGATHERQQ instruction gathers 64-bit values from memory using vector indices. Its critical property: if an address is inaccessible, the corresponding XMM element is left unchanged rather than faulting. This makes it useful for probing. Bloodhound exploits this:
- Set XMM0 to contain two addresses: a known-valid region and the test address.
- Execute VPGATHERQQ with a scale of 1.
- After execution, check if XMM0 changed. If the test address was accessible, both elements update. If inaccessible, the test element retains its original value.
The single-stepping via __debugbreak() (which raises #DB) is necessary because VPGATHERQQ itself does not signal faults conventionally. The VEH handler watches for the second #DB on the same instruction - if VPGATHERQQ faults internally, it triggers a second single-step before completing, which the handler detects. This is an intricate abuse of the debug exception delivery mechanism.
Detection flow:
┌─────────────┐     ┌─────────────┐     ┌──────────────┐
│ Find RET in │────→│ Execute RET │────→│ VPGATHERQQ   │
│   page      │     │ (force exit)│     │ check access │
└─────────────┘     └─────────────┘     └──────┬───────┘
                                              │
                                     ┌────────┴────────┐
                                     │ Confidence ≥ 90% │
                                     │ after 100 iters  │
                                     └────────┬────────┘
                                              │
                                   ┌──────────┴──────────┐
                                   │ EPT Hook Detected   │
                                   └─────────────────────┘
checkhv_um
Source file: hv_um.cpp
Method: User-mode hypervisor detection using multiple heuristics:
- CheckSyntheticCPUID: Queries CPUID leaf 0x40000000 for Hyper-V/VMware/KVM/Xen signatures.
- CheckCrystalClock: Compares CPUID-derived crystal clock frequency with measured RDTSC frequency over QPC wall time; mismatch >5% is suspicious.
- CheckKUserSharedData: Reads
KUSER_SHARED_DATA.InterruptTimeand checks delta against RDTSC; deviation outside ±10% suggests timer virtualization. - CheckUMIP_SGDT: Measures
SGDTlatency - bare metal takes 5-15K cycles (UMIP emulation), very fast SGDT suggests hypervisor fast path. - CheckSchedulerSignature:
Sleep(0)wakeup latency via QPC; >1ms mean suggests vCPU scheduling overhead. - CheckTLBEPTPressure: TLB hit vs page-walk latency ratio; >10x indicates nested paging.
- CheckTSCNoiseFloor: Distribution of consecutive RDTSC deltas; >10% peaks above 1.5x mean is suspicious.
- CheckERMSBEPT: Debug register (Dr0) set during
REP MOVSB- a hypervisor may suppress the debug trap before it fires.
Key excerpt:
void CheckTLBEPTPressure() {
    // TLB-friendly: sequential 64B strides
    for (size_t i = 0; i < 10000; i += 64) {
        *(volatile char*)(region + i) = 0x42;
        hit_latencies.push_back(__rdtsc() - t1);
    }
    // TLB-unfriendly: sparse 64KB strides
    for (size_t i = 0; i < alloc_size; i += 4096 * 16) {
        *(volatile char*)(region + i) = 0x42;
        walk_latencies.push_back(__rdtsc() - t1);
    }
    double ratio = mean_walk / mean_hit;
    bool anomaly = (ratio > 10.0);
}
Strengths: Multi-signal approach - no single heuristic is definitive, but combined they provide strong evidence. The ERMSB debug register check is particularly clever.
Weaknesses: User-mode only - can be sandboxed or intercepted. Thresholds (5%, 10%, 10x) are heuristic and may produce false positives on some hardware. TSC noise check is sensitive to system load.
ept-hook-detection (momo5502)
Source files: main.cpp, ept_hook_checks.h, timing_check.cpp, write_check.cpp, thread_check.cpp
Method: Three detection primitives for EPT hooks:
Timing check (timing_check.cpp):
bool ept_hook_timing_check(void* pointer_in_page) {
    // Find a RET in the page
    auto* ret = find_ret_in_page(pointer_in_page);
    // Measure 20 reads, then 20 alternating read+execute
    auto reads = measure_reads(ret, 20);
    auto execs = measure_executions_with_alternating_reads(ret, 20);
    // If execs >> reads, likely an EPT hook
    return (reads * 4) < execs;
}
Write check (write_check.cpp): Overwrites a 0xCC (INT3) with 0xC3 (RET). If the write doesn't affect execution (still throws despite being a valid RET), an EPT hook re-mapped the page.
// Overwrite CC with C3
write_byte(pointer, 0xC3);
// If it STILL throws after the write, EPT is hiding the original CC byte
bool hooked = execute_throws(pointer);
Thread check (thread_check.cpp): Uses a secondary thread as a software clock (counter increment) to measure execution latency without relying on RDTSC - the counter thread runs on a different core, and the measurement is based on how many increments occur during the probe.
Strengths: Three complementary methods - timing catches latency anomalies, write catches EPT view-switching failures, thread check avoids TSC-based timing entirely. Multi-core detection catches per-VCPU view-switching bugs.
Weaknesses: The write check modifies memory (temporarily), which could cause issues in production. The timing check requires a RET instruction in the target page (not always present). False positives on heavily loaded systems.
ermsb-meme (ERMSB EPT Detection)
Source file: main.c
Method: Uses REP MOVSB (ERMSB - Enhanced REP MOVSB/STOSB) with a hardware debug breakpoint on the destination page. On bare metal, the debug trap fires reliably during the string copy. If the copy is under EPT control, the hypervisor may intercept before the debug logic triggers.
int probe_page(uint64_t page) {
    CONTEXT ctx = {0};
    ctx.ContextFlags = CONTEXT_DEBUG_REGISTERS;
    ctx.Dr0 = page + 8;     // Break on address
    ctx.Dr7 = 0x30001;       // Enable, execution breakpoint
    SetThreadContext(GetCurrentThread(), &ctx);

    __try {
        // REP MOVSB copies 0x2000 bytes
        // On bare metal, DR0 fires mid-copy
        __movsb((PBYTE)destination, (PBYTE)(page - 0x1000), 0x2000);
    } __except(handler(...)) {
        detecc = 1;  // Exception handler fired - trap was NOT suppressed
    }

    if (detecc == 0) {
        // Trap was suppressed - hypervisor is hiding the page
        return DETECTED;  // EPT HOOK
    }
    return NOT_DETECTED;
}
Key insight: The ERMSB microcode reads source bytes in bulk. If the hypervisor is using EPT execute-only to hide a page, the hardware debug mechanism may trigger before the EPT violation check, or the hypervisor may fail to forward the debug exception to the guest.
Strengths: Extremely low false-positive rate. Exploits a real difference in the order of exception delivery between bare metal and virtualized environments.
Weaknesses: Requires one valid/present page preceeding the target (as a buffer). Only works on Intel CPUs with ERMSB support. The technique is subtle and may behave differently across microcode revisions.
Why ERMSB matters for detection:
ERMSB (Enhanced REP MOVSB/STOSB) was introduced in Ivy Bridge. The microcode implementation performs bulk reads from the source - it fetches cache-line-sized chunks rather than byte-by-byte. When a debug register breakpoint (Dr0-Dr3) matches an address in the destination, the expected behavior on bare metal is:
- ERMSB copies bytes until it reaches the breakpoint address.
- The CPU raises
#DB(debug exception) mid-copy. - The OS exception handler fires.
Under EPT control, the order may differ. If the source page is mapped through an EPT entry that causes a violation during the bulk read, the EPT fault may fire first. Or the hypervisor may consume the #DB internally and never deliver it to the guest. The detection exploit: if #DB does not fire when expected, the hypervisor intercepted it. This is not something the hypervisor can easily fix, because the exception delivery order is microarchitectural and varies by implementation.
hvdetecc
Source files: main.cpp, hypervisor_detection.cpp, environment.cpp, benchmark.hpp, interrupt_guard.hpp, os.cpp, upause.hpp
Method: A kernel-mode driver with the broadest test set in this group. It runs at IRQL = 2 (DPC) and performs:
Processor behavior tests (hypervisor_detection.cpp):
| Test | What It Checks |
|---|---|
vm.hvFlagSet | CPUID.1.ECX hypervisor bit |
vm.vmwareIo | VMware backdoor I/O port (0x5658) |
vm.smiSuppressed | SMI counter at I/O port 0xB2 - if count doesn't increment as expected |
vm.strEmulFail | STR instruction emulation inconsistencies |
vm.sldtEmulFail | SLDT instruction emulation inconsistencies |
vm.dbSuppressed | Suppressed #DB - writes DR0, sets Dr7, triggers INT2, counts deliveries |
vm.turboSuppressed | Writes to IA32_MISC_ENABLE bit 38 (turbo boost) don't stick |
vm.pmcMsrMismatch | Written PMC value not sustained - counter virtualization detected |
vm.rdpmcMismatch | RDPMC returns wrong value |
vm.pmcDead | PMC doesn't increment when enabled |
vm.pebsSuppressed | PEBS enable bit not retained |
vm.xgetbvEmulFail | XGETBV with high trashed doesn't mask upper bits |
vm.xsetbvLeafEmulFail | XSETBV with invalid ECX doesn't fault |
vm.smswEmulFail | SMSW doesn't match CR0 |
vm.cpuidEcxSuppressed | CPUID leaves 0xD.0 and 0xD.1 identical (ECX ignored) |
vm.lbrSuppressed | LBR enable bit not retained |
vm.btsOsFault | BTS OS bit causes fault |
vm.btfSuppressed | BTF + Trap Flag interaction fails |
vm.ptSuppressed | Intel PT trace enable bit discarded |
vm.msrDefaultInvalid | RDMSR on invalid MSR doesn't #GP |
vm.hvMsrs | Reads to 0x4B564D01 and 0x40000000 don't #GP (VMware/HV MSRs present) |
vm.tscMsrEmulFail | TSC MSR (0x10) delta >1500 cycles |
vm.hiddenClocks | MPERF or APERF missing |
vm.tscWarped | TSC_ADJUST write causes TSC to regress |
vm.eferNxDiscard | Disabling NX in EFER, executing NX page - should fault |
Environment validation (environment.cpp):
- Verifies PatchGuard context ran (
pg.noPgBoot) - Compares loaded module checksums with on-disk images (
img.patch.*) - Checks driver dispatch tables for hijacked entries (
img.dispatchHijacked.*) - Verifies HAL dispatch table integrity (
hal.hook.*)
Benchmarking (benchmark.hpp):
Measures instruction execution time across multiple clock sources simultaneously: TSC, PMC fixed counters (core, TSC), MPERF, APERF, PPREF, HPET, multi-processor clock, TLB persistence, DRAM/package energy.
Key excerpt:
// SMI count test - hypervisors often suppress SMIs
void test_smi(...) {
    // Configure PMU counter for SMI received
    ia32::pmu::dynamic_set_state(0, ia32::pmu::event_id::smi_received, ...);

    // Cause random number of SMIs via I/O port 0xB2
    size_t count = xstd::make_random(1, 8);
    size_t ecount = read_counter();
    while (count) {
        ia32::write_io(0xB2, 0);
        --count; ++ecount;
    }
    size_t rcount = read_counter();
    detections["vm.smiSuppressed"] = rcount < ecount;
}
Strengths: Broadest test set I looked at: 30+ checks across processor behavior, MSR integrity, debug features, performance monitoring, and memory management. Runs at DPC level for steadier timing. Uses multiple clock sources so TSC virtualization is not the only signal.
Weaknesses: Kernel-mode only. Can trigger PatchGuard (Kernel Patch Protection) on 64-bit Windows. Some tests (NX disable, MOV SS+INT2) are inherently risky and could crash the system if the hypervisor handles them unexpectedly. Heavy - not suited for lightweight scanning.
Dispatch table integrity (environment.cpp - detailed):
hvdetecc's environment validation goes beyond simple presence checks. The dispatch table hijack detection is particularly thorough:
- PatchGuard context validation: Locates the PatchGuard context pointer in
ntoskrnl.exe's.datasection by searching for a known three-pointer suffix (KeBugCheckEx,KeBugCheck2,KiBugCheckDebugBreak). If the context pointer at offset -8 is NULL, PatchGuard never initialized - the kernel's integrity monitor was suppressed. - Module checksum comparison: For every loaded kernel module, reads the on-disk file (via
ntpp::read_file), compares the PE optional header checksum. If checksums match, compares the full image hash viantpp::ci::compare. A mismatch with matching checksums is a strong indicator of in-memory patching. - Dispatch table verification: Enumerates
\Driverdirectory, obtains each driver object, checks everyMajorFunctionentry. An entry whose PXE (page table index) is neither kernel-space nor the expected shared-user-page index has been redirected - the dispatch pointer lands in an unexpected code region. - HAL dispatch integrity: Validates both
HalDispatchTable(0xA8 bytes → 20 entries) andHalPrivateDispatchTable(0x300 bytes → 95 entries). Any entry with a non-canonical or non-kernel-space target is flagged.
The PXE comparison method (checking ia32::mem::px_index(entry) against known kernel and user ranges) is faster than validating individual addresses against module bounds, and it has fewer moving parts. It catches any redirection that leaves kernel space, which covers all EPT-based dispatch table hooks.
Benchmark multi-clock analysis:
hvdetecc's benchmark.hpp doesn't just measure one clock - it measures across seven independent time sources simultaneously:
- TSC: The primary timestamp counter, most likely to be spoofed
- MPERF: Maximum core frequency counter, reads actual CPU P-states
- APERF: Actual core frequency counter, reflects real cycles executed
- PPERF: Product performance counter, accumulated across all P-states
- Fixed PMC0 (instructions): Instructions retired, independent of frequency
- Fixed PMC1 (core cycles): Actual unhalted core cycles
- Fixed PMC2 (TSC reference): Reference cycles at constant rate
- HPET: High Precision Event Timer, MMIO-based, hard to virtualize
Any hypervisor that virtualizes TSC but leaves one of these other counters unvirtualized creates a timing discrepancy. The ratio of MPERF:APERF reveals actual P-state residency; if it disagrees with TSC-derived timing, the hypervisor is manipulating TSC. Similarly, HPET vs TSC divergence over long measurement intervals cannot be explained by interrupt jitter.
VMAware
Source files: vmaware.hpp (~14,000 lines header-only), cli.cpp
Method: Cross-platform (Windows, Linux, macOS, ARM) detection library with ~90 techniques organized by platform. Uses a scoring system: each technique contributes 0-100 points to a brand-specific scoreboard. Total score >150 = VM detected. Brands with highest score are returned.
Key techniques:
| Technique | Score | Method |
|---|---|---|
VM::VMID | 100 | CPUID 0x40000000 vendor string match |
VM::CPU_BRAND | 95 | CPU brand string matching (QEMU, KVM, VirtualBox, etc.) |
VM::HYPERVISOR_BIT | 100 | CPUID.1.ECX bit 31 |
VM::HYPERVISOR_STR | 100 | CPUID hypervisor string leaf |
VM::CPUID_SIGNATURE | 95 | APIC ID consistency cross-check (0xB vs 0x1F leaves) |
VM::BOCHS_CPU | 100 | Bochs CPU ID quirks |
VM::KGT_SIGNATURE | 80 | Intel KGT (Trusty) signature |
VM::TIMER | 95 | Software-clock-based timing with cache-line isolation |
VM::THREAD_MISMATCH | 50 | Cross-core timing discrepancy |
VM::SYSTEM_REGISTERS | 50 | STR/SLDT/LAR emulation |
VM::FIRMWARE | 100 | ACPI/FW tables contain VM signatures |
VM::DEVICES | 95 | PCI device vendor/model matching |
VM::MSR | 100 | MSR probing (see hvdetecc section for details) |
VM::TRAP | 100 | Exception handling quirks |
VM::DRIVERS | 100 | Loaded driver name scanning |
The VMAware timer technique:
// VMAware's TIMER technique: uses a software clock instead of RDTSC
// A counter thread increments a volatile counter while a trigger thread
// executes CPUID. The counter rate difference reveals VM exit latency.

auto counter_thread = [&]() {
    // Bind to a non-sibling core
    SetThreadAffinityMask(current_thread, target_affinity);
    while (!state.start_test) {}
    while (!state.test_done) {
        state.counter++;  // software clock
    }
};

auto trigger_thread = [&]() {
    // Measure counter rate during CPUID (causes VM-exit)
    u64 before = counter;
    trigger_vmexit();  // CPUID instruction
    u64 after = counter;
    // Ratio of (after - before) for CPUID vs no-op reveals overhead
    double ratio = (double)(after - before) / baseline;
    return (ratio > 3.5);
};0xB, 0x1F, 0xB). If the first and third reads match but the second is different, or if all three are different, the thread migrated between cores during the check - a tell of vCPU scheduling in a VM.Strengths: Cross-platform, header-only, zero external dependencies. ~90 techniques with fine-grained control. The software-clock approach gets around simple TSC offsetting. The CPUID signature check with an ABA pattern is careful, and the brand identification is unusually detailed.
Weaknesses: Some techniques are platform-restricted (only Windows, only Linux). Scoring threshold (150) is heuristic. The full detection pass can take several seconds. Some file-based techniques (PCI device scan, DMI decode) depend on specific OS paths.
VMAware's brand scoreboard system:
The scoring system is the core of VMAware's design. Rather than a binary "VM or not?" answer, it maintains a per-brand accumulator:
struct brand_scoreboard {
    int VMware      = 0;
    int VirtualBox  = 0;
    int QEMU        = 0;
    int KVM         = 0;
    int HyperV      = 0;
    int Parallels   = 0;
    int Xen         = 0;
    int Bhyve       = 0;
    int QNX         = 0;
    int ACRN        = 0;
    int Bochs       = 0;
    int NVHypervisor = 0;
    int AppleHypervisor = 0;
};

// Each technique adds its score to matching brands
void add_score(const char* technique, int points, std::vector matches) {
    for (auto& b : matches) {
        scoreboard[b] += points;
    }
}
The brand identification is valuable beyond detection: knowing which hypervisor is present informs the appropriate response. Detection of a VMware workstation is different from detection of Hyper-V with VBS - the former may indicate an analysis environment, the latter is the default Windows security configuration.
Cross-platform architecture:
VMAware achieves cross-platform support through compile-time platform detection and runtime feature discovery:
- Windows: Uses
NtQuerySystemInformation,EnumDeviceDrivers,SetupDiGetClassDevs, WMI queries, registry keys (HKLM\HARDWARE\DESCRIPTION\System\BIOS) - Linux: Reads
/sys/class/dmi/id/,/proc/cpuinfo,/proc/scsi/scsi,cpuidinstruction directly - macOS: Uses IOKit (
IOServiceGetMatchingServices), sysctl,IOPlatformExpertDevice - ARM: Detects hypervisor mode via
MRS(readingHSTR/HCR), checks for EL2 exception level
The ARM support is noteworthy because most detection tools are x86-only. VMAware's ARM hypervisor checks handle both ARMv7 (Virtualization Extensions) and ARMv8 (EL2 exception level), covering Android emulators and Apple Silicon virtualized environments.
Practical Detection Engineering Guide
Choosing Detection Methods by Threat Model
Not every detection method is appropriate for every scenario. The choice depends on what kind of hypervisor you expect and what privilege level you have:
| Scenario | Recommended Methods | Avoid |
|---|---|---|
| User-mode integrity scanner | Driver scan, SharedPage(0xC5), thread-check timing, CPUID signature | Kernel-mode tests, MSR probing (triggers EDR) |
| Malware analysis VM detection | Synthetic CPUID, TLB pressure, crystal clock, VM driver enumeration | SMM probes (requires ring 0) |
| Kernel-mode EDR / rootkit scanner | EPT hook scan, dispatch table integrity, MSR probe, PMU validation | Nothing - use everything available |
| Forensic acquisition (physical access) | DMA read, SMM verification, firmware attestation | Guest-side-only checks |
| Cloud VM (guest only) | Timing analysis, cache contention, RSB probing | MSR writes (hypervisor-controlled), SMM (absent in most clouds) |
Building a Correlation Engine
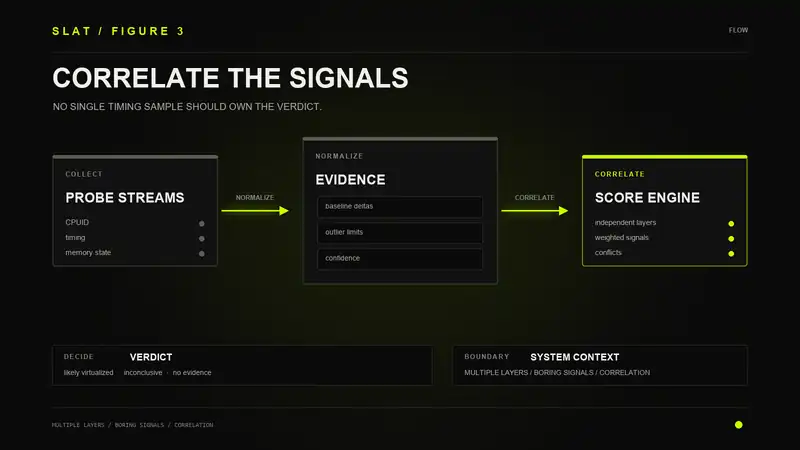
Single-signal detection is fragile. If I were building a correlation engine for this, I would keep it boring and use four rules:
- Independent probes: Each probe should rely on a different hardware mechanism. Two timing probes using RDTSC are not independent - the hypervisor spoofs one, it spoofs both.
- Orthogonal measurement paths: Pair RDTSC-based timing with thread-counter-based timing, TLB profiling with cache contention, CPUID checks with MSR integrity checks.
- Baseline calibration: Run probes during low-contention periods and compare against a known-bare-metal baseline for the same CPU model.
- Bayesian updating: Each probe result shifts the probability of virtualization. A "high" result from a timing probe might shift from 50% to 70%; a matching "high" from TLB profiling shifts from 70% to 95%. A conflicting "low" from CPUID signature drops it back to 60%.
// Simplified correlation engine
typedef struct { double prob_vm; double weight; } probe_result_t;

probe_result_t probes[] = {
    { timing_probe(),     0.35 },
    { tlb_profile(),      0.25 },
    { cache_contention(), 0.20 },
    { dispatch_integrity(),0.15 },
    { shared_page(),      0.05 }
};

double aggregate = 0.0;
double total_weight = 0.0;
for (int i = 0; i < NUM_PROBES; i++) {
    aggregate += probes[i].prob_vm * probes[i].weight;
    total_weight += probes[i].weight;
}
double final_score = aggregate / total_weight;
bool vm_detected = (final_score > 0.75); // thresholdDetection Difficulties & Limitations
False Positives
| Signal | Legitimate Cause of False Positive |
|---|---|
| High CPUID latency | SMI handling, C-state transitions |
| TLB pressure >10x | Large working set, TLB thrashing |
| Suspected EPT hook | Hyper-V with VBS enabled, security hypervisors |
| Suspected driver scan | Security software or EDR that loads its own drivers |
| Timer anomalies | Power management, frequency scaling |
The Security Hypervisor Problem
Windows Virtualization-Based Security (VBS), Hyper-V, and KVM with SEV-SNP are legitimate hypervisors that use the same SLAT mechanisms as rootkits. Detection tools must distinguish:
- "Is there a hypervisor?" → Easy, but not very useful.
- "Is there an unexpected hypervisor?" → Much harder.
- "Is there an EPT hook on this specific page?" → The real detection question.
This is why tools like Bloodhound and ept-hook-detection focus on page-local checks rather than global hypervisor presence detection.
Performance Impact
Kernel Patch Guard (KPP/PatchGuard)
On 64-bit Windows, PatchGuard monitors kernel code, data structures, and MSRs. Detection tools that modify page tables, debug registers, or MSRs risk triggering a bug check (0x109). hvdetecc addresses this by running at DPC level and being careful about state restoration, but the risk is inherent.
AMD NPT-Specific Limitations
AMD's NPT presents unique challenges for both attackers and defenders:
- No execute-only pages: On most AMD silicon, setting X=1 on an NPT entry implicitly grants read access. This eliminates the clean split-view hook as a stealth option. Attackers must use more detectable methods: transient entry swapping (which produces more faults), or full R/W/X shadow pages (where integrity scanners can read the hook code).
- #VMEXIT(NPF) granularity: The nested page fault delivers
EXITINFO1which distinguishes between faults during a guest page table walk and faults at the final GPA. A detector that deliberately causes page-table-walk faults and final-GPA faults can measure the hypervisor's handling latency for each case - they should be nearly identical on bare metal but diverge under NPT. - ASID management: AMD's ASIDs max out at 65535 on newer silicon, but many hypervisors only allocate a handful. Forcing rapid ASID exhaustion (by rapidly creating and destroying processes with different CR3 values) may reveal the hypervisor through ASID allocation failures that don't occur on bare metal.
- AVIC (Advanced Virtual Interrupt Controller): AMD's hardware APIC virtualization reduces exits for interrupt handling. A detector can probe for AVIC by configuring x2APIC and measuring interrupt delivery latency - AVIC delivers in <100 cycles vs 500+ cycles through software emulation.
Calibrating Detection Thresholds
Static thresholds (e.g., "ratio > 10x") are fragile across hardware generations. Proper calibration requires:
- Per-CPU model baselines: Record probe results on known-bare-metal instances of the target CPU model. Store these as reference distributions.
- Runtime calibration: Before running detection probes, measure idle-system noise. Subtract this baseline from subsequent measurements.
- Adaptive thresholds: Set thresholds at
mean + 5 * stddevof the bare-metal distribution, not a hardcoded number. - Cross-boot consistency: If thresholds were valid during a previous boot on the same hardware, they should still be valid. A system that crosses the threshold since last boot without hardware changes is suspicious.
Intel PT and the Hypervisor Boundary
Intel Processor Trace is both a detection tool and a target of hypervisor evasion. The interaction is worth examining in detail because PT operates at a privilege level that straddles the hypervisor boundary:
How PT Crosses VM Boundaries
When Intel PT is active on the host, the hardware traces everything that executes on that logical core - host code, guest code, and the transitions between them. The VMCS provides controls to manage this:
VM_ENTRY_CTLS: VM_ENTRY_LOAD_RTIT_CTL: On VM entry, loadIA32_RTIT_CTLfrom the VMCS. This allows the hypervisor to reconfigure PT for guest execution - disabling it, changing the ToPA, or switching to a guest-specific buffer.VM_EXIT_CTLS: VM_EXIT_LOAD_RTIT_CTL: On VM exit, restore the host'sIA32_RTIT_CTL. If this bit is set, the host's tracing configuration is restored before the exit handler runs, so the handler is never traced by the guest configuration.VM_EXIT_CTLS: VM_EXIT_CLEAR_RTIT_CTL: On VM exit, zero outIA32_RTIT_CTLentirely. This guarantees no trace packets are generated after the exit, regardless of configuration.
A hypervisor that leaves PT enabled during guest execution creates a detection surface: the guest can read its own trace data and observe VM-exit boundaries as gaps in the trace. A hypervisor that correctly swaps PT configuration on boundaries removes this signal - but the PT MSRs themselves become a detection target (see hvdetecc's vm.ptSuppressed test).
Using PT as a Guest-Side Detector
If PT is available inside the guest (unlikely in most VM configurations, but possible in nested virtualization or misconfigured VMs), a detector can:
- Enable PT with
TraceEn=1, User=1, OS=1on a target logical CPU. - Execute a known sequence of instructions with predictable timing (e.g., 1000 NOPs followed by a CPUID).
- Disable PT and decode the trace.
- Check for gaps in the instruction stream - a gap after CPUID indicates a VM-exit boundary where PT was suppressed.
- Check CYC packet frequency - if cycle counts are missing or compressed around VM-exit points, the hypervisor is suppressing timing packets.
This is a niche technique because PT is rarely available inside guests. In environments where it is exposed, such as KVM with PT passthrough or Xen with PT sharing, it gives a useful instruction-level trace.
Comparison Matrix
| Detection Method | CPUID | Timing | MSR | TLB | SMM | EPT Hook | Driver Scan | SharedPage |
|---|---|---|---|---|---|---|---|---|
| CPUID check | ✓ | |||||||
| Timing analysis | ✓ | |||||||
| MSR probe | ✓ | |||||||
| TLB profile | ✓ | |||||||
| SMM monitor | ✓ | ✓ | ✓ | ✓ | ✓ | ✓ | ||
| EPT hook scan | ✓ | |||||||
| Driver scan | ✓ | |||||||
| SharedPage (0xC5) | ✓ | |||||||
| Bloodhound | ✓ | |||||||
| checkhv_um | ✓ | ✓ | ✓ | ✓ | ||||
| ept-hook-detection | ✓ | ✓ | ||||||
| ermsb-meme | ✓ | |||||||
| hvdetecc | ✓ | ✓ | ✓ | ✓ | ✓ | ✓ | ||
| VMAware | ✓ | ✓ | ✓ | ✓ |
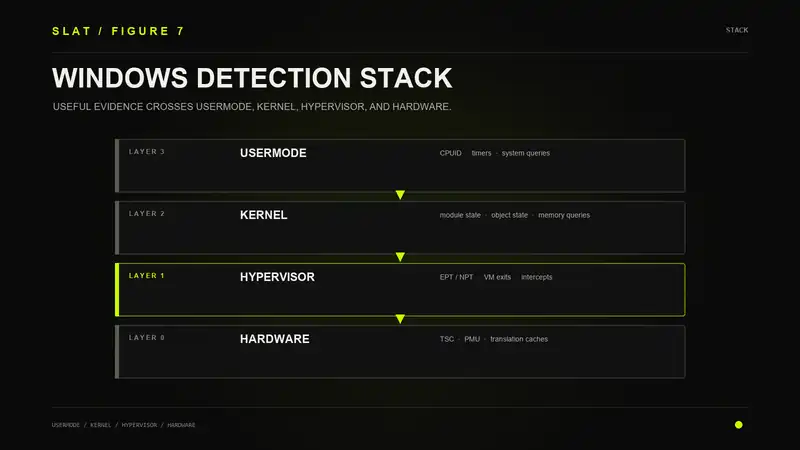
Windows Detection Stack Architecture
Where The Signals Hold Up
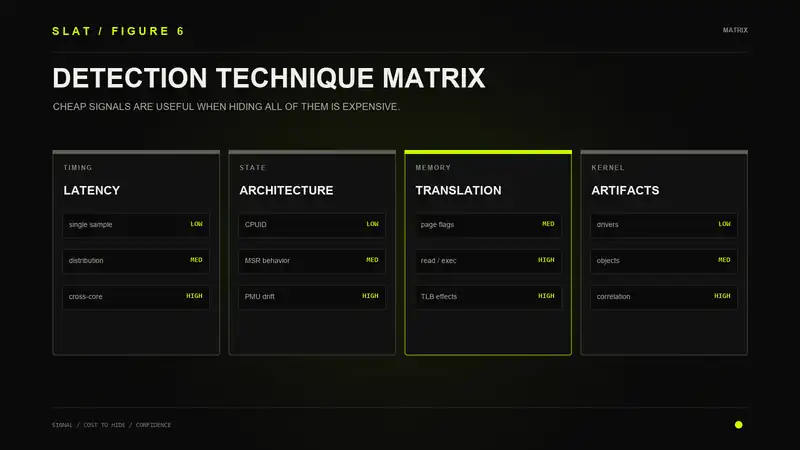
The easy signals are architectural: CPUID leaves, synthetic MSRs, shared pages, and obvious vendor strings. Treat those as quick triage, not proof.
Timing and microarchitectural signals are harder to clean up. A hypervisor can hide one counter or one instruction path, but it has a harder time keeping TSC, HPET, PMU counters, TLB pressure, cache contention, and exception ordering all believable at once.
TDX, SEV-SNP, and DRTM change the trust model rather than solving every runtime question. They are still worth tracking because they shrink the room a stealth hypervisor has to lie about memory.
The checks I would test next are plain ones: how stable timing baselines are across laptops, how much VBS noise looks like a malicious hypervisor, and which page-local probes survive a week of normal workstation use without false positives.
References & Further Reading
Papers:
- SubVirt: Implementing malware with virtual machines (King et al., 2006)
- Blue Pill (Rutkowska, 2006)
- HyperLeech: DMA-based hypervisor injection (RAID 2020)
- Detecting Introspection from Guests (DFRWS 2018)
Tools analyzed:
- Bloodhound - github.com/Skeletal-Group/Bloodhound
- checkhv_um - github.com/llamasoft/checkhv_um
- ept-hook-detection - github.com/momo5502/ept-hook-detection
- ermsb-meme - EPT detection via ERMSB debug register technique
- hvdetecc - Kernel-mode hypervisor detection
- VMAware - github.com/kernelwernel/VMAware
Intel/AMD Manuals:
- Intel SDM Vol. 3, Chapters 23-29 (VMX, EPT, VPID)
- AMD APM Vol. 2, Chapters 10-15 (SVM, NPT)
Other:
- Ophion stealth hypervisor (VT-x, firmware-locked model)
- Intel KGT (Trusty branch) - github.com/intel/ikgt-core
- Windows Hyper-V TLFS (Top-Level Functional Specification)
Appendix: Research File Citations
Research documents
deep-research-report-GG.txt- Core analysis of EPT/NPT mechanics, split-view hooks, statistical IET analysis, RSB/cache probing, HPC monitoringdeep-research-report-GPT.md- Stealth SLAT hook detection, altp2m, VMFUNC, VPID/ASID, TSC compensationdeep-research-report-merged.txt- Combined analysis with detection priorities, case studies (SubVirt, Blue Pill, HyperLeech, Ophion), and cross-view comparison
Detection tools
Detections/Bloodhound-main/Bloodhound.cpp- VPGATHER-based EPT hook detection with execute/read asymmetryDetections/Bloodhound-main/VPGATHER.cpp- AVX2 VPGATHERQQ address accessibility probe via #DB single-steppingDetections/checkhv_um-master/hv_um.cpp- User-mode multi-heuristic detection (CPUID, crystal clock, TLB pressure, TSC noise, ERMSB)Detections/ept-hook-detection-main/*- Three-pronged EPT hook detection (timing, write, thread-based)Detections/ermsb-meme-main/main.c- REP MOVSB debug register EPT detectionDetections/hvdetecc-master/*- 30+ kernel-mode detection tests (SMI counting, MSR integrity, PMU, PEBS, XSAVE, debug features)Detections/VMAware-main/src/vmaware.hpp- 90-technique cross-platform detection library with scoring systemDetections/VMAware-main/src/cli.cpp- CLI frontend for VMAware library
Manuals
Manuals/Intel Manuals/vol-3.pdf- Intel SDM Vol 3: VMX, EPT, VPID, APICvManuals/Intel Manuals/vol-4.pdf- Intel SDM Vol 4: MSR descriptionsManuals/Amd Manuals/*.pdf- AMD APM: SVM, NPT, ASID
Supplemental Driver Scan/SharedPage data
- Repeated driver scanning: 10+ passes, ~4,674 string compares, 11 blacklisted driver names
SystemHypervisorSharedPageInformation(NtQuerySystemInformation class 0xC5): returns user-space mapping of hypervisor shared page, or NULL if absent